CCP released the Monthly Economic Report yesterday, with fixes to account for mining drones and correctly calculate total trade in regions. Full graphs can be seen in the devblog, but we will quickly run through some of the interesting ones here.
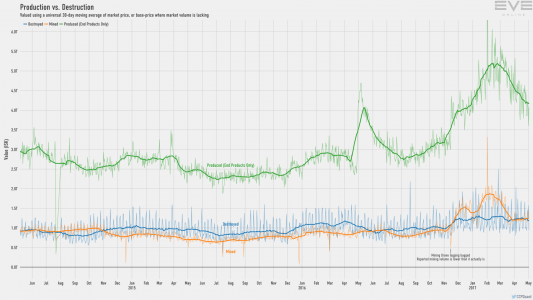
First up is the production vs destruction graph, which shows that production is continuing to decline from its peak in February. The climb in Autumn last year was partly due to the release of Engineering complexes and their proliferation. The slump post-February is down to a number of factors, including stockpiling of minerals occurring as their prices fall, and saturation of the market for both Citadels and Engineering Complexes, with smaller structures selling below build cost. The Rorqual changes have also reduced demand, and those who want them have largely got them by now.
As we will see later, production is still continuing apace, so don’t panic about that, but it is dropping off from its peak. I expect there to be a spike again as we move towards the release of Refineries towards the end of the year. A war kicking off could also spike production again, but there are large stockpiles of ships dotted around New Eden.
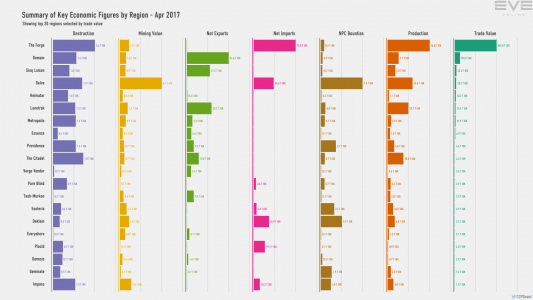
The next chart provided summarises the key details of the MER.
Now that mining is accurately reported (previous reports did not include the figures from mining drones), as well as the trade values now showing Citadels and Engineering Complexes with markets, we can get a better overview of what is going on in Eve.
As expected, the economic dominance of Delve is clear, with the correct trade values now showing the region to be behind only The Forge, Domain and Sinq Laison. This is the first time that Delve has appeared on the summary, as without citadels, Delve only had around 500b of trade per month and so did not feature on the top 20 regions to make it into the summary each month.
This was last months regional summary:
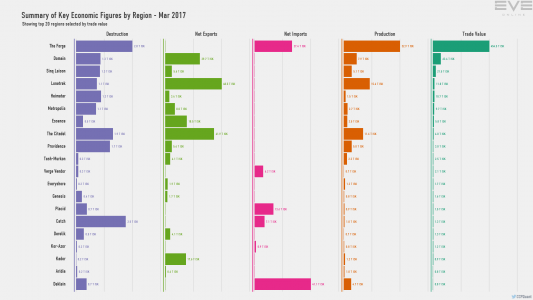
By comparing last month’s numbers for total trade, and this month, we can get an approximation of the trade done in citadels in each of the top 20 regions, and by extension, an estimate of income from citadels. To take a look at some of the key regions and their approximate income from citadels:
The Forge: 115B (assuming average 0.1% broker fee rate)
Domain: 3b (Assuming 0.5% broker fee)
Sinq Laison: 18B (Assuming 1% broker fee)
Delve: 364B (Assuming 2% broker fee)
Providence: 15B (Assuming 1% broker fee)
This roughly matches with the calculations we did last month using CREST exports to calculate citadel incomes.
Mining
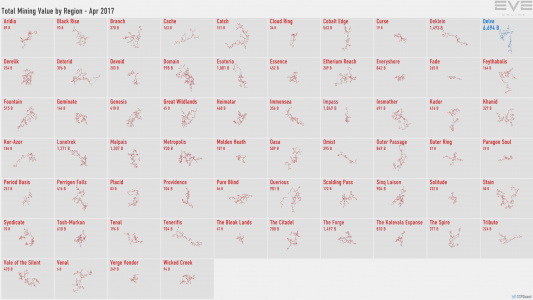
Mining value is one of the frustrating figures for me, as until this month it did not include mining done by drones, which meant the numbers from nullsec did not accurately include Rorquals. Usually, this would not have been so much of an interesting topic (apart from Delve does a lot of mining, but we already knew that), but last month, TEST did their Manhattan project, or “Mine for a month to build Dreads.” This was announced at the beginning of April, so a comparison to the March MER would have provided some gauge for how much they did, unfortunately, not only did previous months not include drones, but the March MER did not have mining in it at all due to a problem with the data.
What is clear from the mining graphic is how under-reported mining was before. In the last MER to have mining data (February), Delve had 1.6T ISK worth of mining done, the highest in New Eden. Now with drones added, it has 6.6T ISK worth of mining in the region, putting Delve in a different league to every other region in Eve. Delve’s closest competitors are Deklein and The Forge, at 1.4T ISK each.
Production
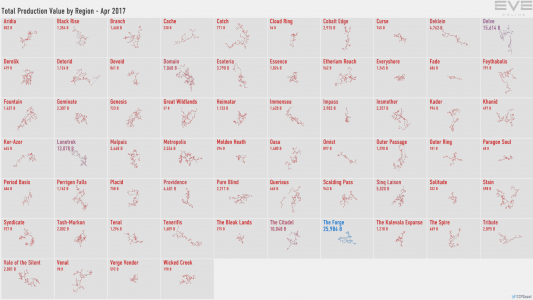
Production, as noted at the top of this article, is down again this month, with the Forge dropping from 32T production down to 25T, and Delve dropping from 19.6T to 15.6T, but both locations retain the #1 and #2 spot in terms of industrious industrialists.
Esoteria saw an increase from 3.5T to 3.7T ISK, perhaps indicating the increase expected during their Dread building marathon.
Staying with production-related topics…
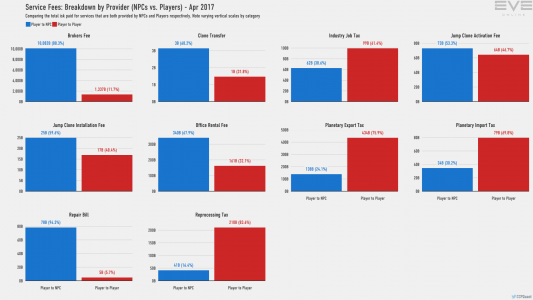
The service fees show how much is paid to NPCs vs Players for various services. Broker fees have stayed pretty much the same month-on-month, 1.36T in March and 1.33T in April, but the ISK received by players for Industry Tax dropped dramatically from 114B to 99B, while that paid to NPCs dropped from 68B to 62B.
Final thoughts
After this month’s corrections, it will be interesting to be able to follow development of citadel markets (or lack of). The surprising thing with being able to compare the two data sets is that outside of The Forge, citadels in highsec really have not had much of an uptake, and given the low tax rates in The Forge, the income is lower than some people expected. The dominance of Delve in many areas will have come as no surprise to most people, although that does not detract from the impressive numbers in any way. Delve mines more than pretty much the rest of nullsec combined, and isn’t far off of producing more than all of nullsec, so “already replaced” is more like “already replaced several times over.”


