We are in a season of giving, so let’s open our presents and see what we’ve received recently. Delve once again looms large and skews the scale, but we we are getting used to seeing that for quite awhile. So, let’s sip some egg nog, relax by the fire, and dig into some of the charts and graphs so handily supplied by Santa CCP in their November Monthly Economic Report.
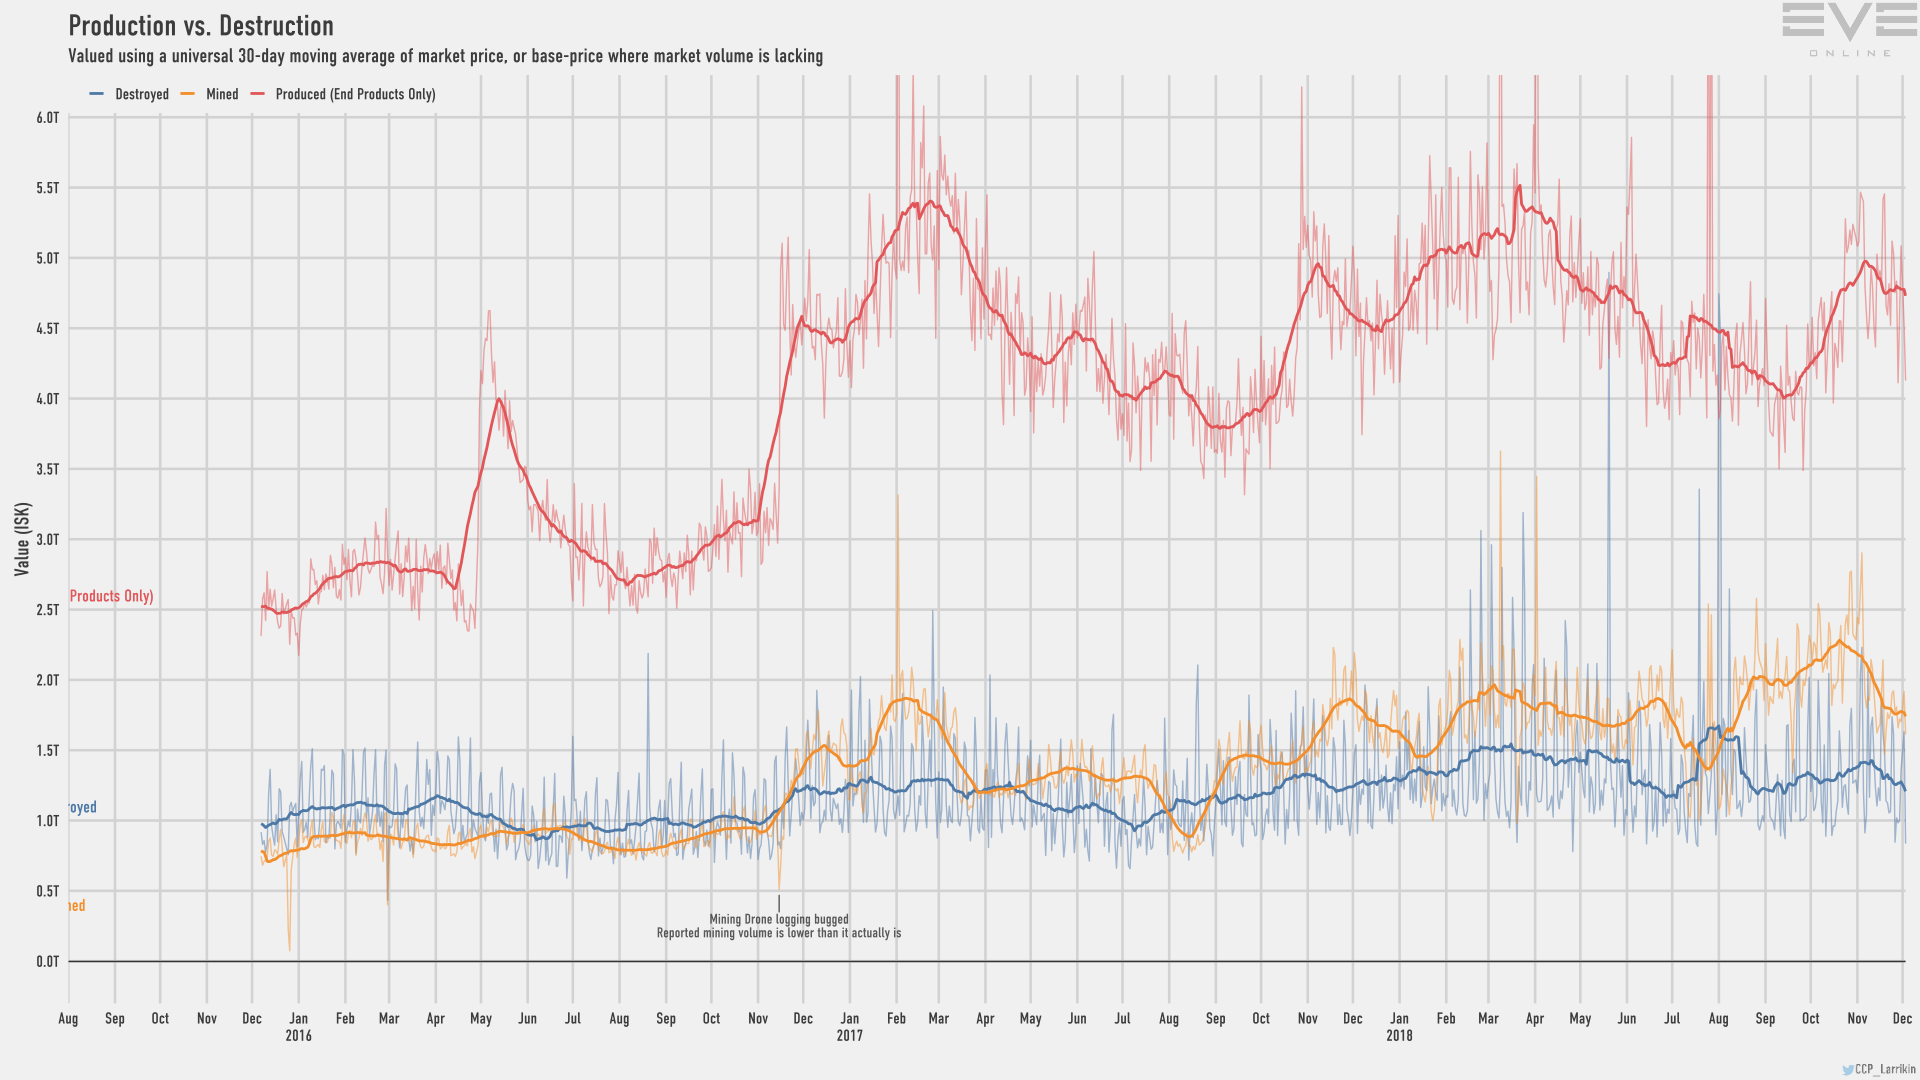
The first graphic above shows production vs. destruction for all of New Eden, not broken out by region. We are seeing a falling line for all three major indicators: production, mining, and destruction. Production ended the month in a decline, at about 4.8 trillion ISK, very close to what it was in November of 2017. Mining, too, is in a tumble, at about 1.75 trillion, though it is clearly ahead of last year’s figures in November. Finally, destruction is also falling and ends the month slightly below last year’s figures. Hmmmmm. Hardly worth unwrapping that kind of gift.
What might all this mean for the state of New Eden? Without other numbers, such as daily log in information, we can only speculate regarding the cause for such a fall. We do notice, however, that every November for the past three years we have seen a similar fall off, indicating that New Eden experiences seasonal booms and busts, which probably reflect an inverse relationship to real world activities. Perhaps around the holidays people spend more time with real family and friends than in PanFam or Goonswarm. I know I’ve spent more time with family, especially around the American Thanksgiving holiday, and this meant less time ratting or mining in EVE. The numbers are diving pretty sharply, though, so we will want to keep a close eye on the MER for December and January, as historically speaking we should see an increase in all three indicators.
Turning now to look at specific regions, we see in the graphic above the top five regions for production include Delve, The Forge, Lonetrek, The Citadel, and Esoteria. Delve and The Forge far outdistance their nearest competitors, with Delve producing 44.2 trillion ISK. To put this into perspective, the 3rd highest producer, Lonetrek, produced 11.9 trillion, or about 25% of what Delve cranks out.
In mining, the disparity between regions is similar. The top five mining areas are Delve, Esoteria, Querious, Fountain, and Detorid. Delve mined over 15 trillion worth of ore. Their nearest competitor, Esoteria, mined 3.6 trillion worth. The Imperium has three regions in the top five, giving credence to the commonly held idea that The Imperium contains the most “autistic” miners in the game. We should also note, however, the emphasis that goon leadership places on mining and the support provided for mining and production.
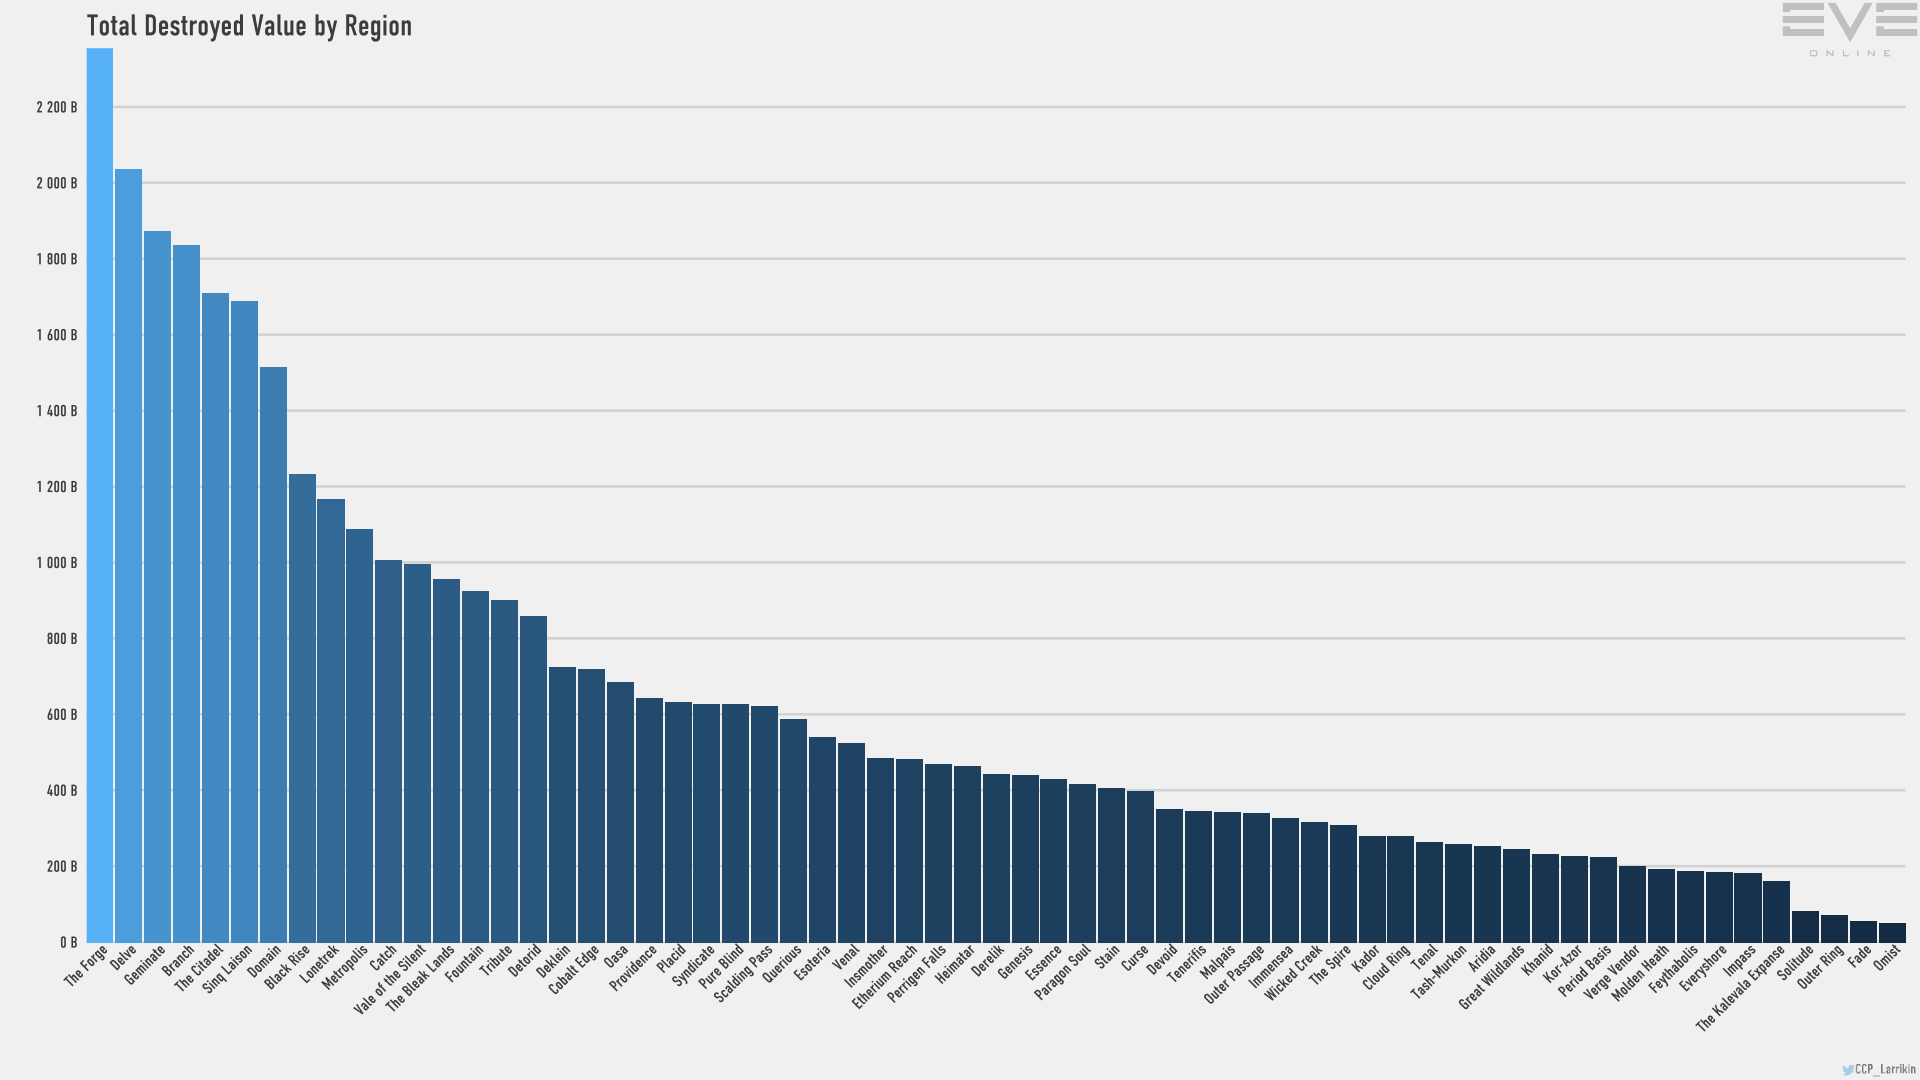
These five regions also show themselves as powerhouses of destruction. In rank, the top five by destruction include Delve, Esoteria, Detorid, Querious, and Fountain. Delve tops out at well over 12 trillion destroyed, while their nearest competitor doesn’t hit 5 trillion. I’m tempted to start singing “Ben,” or at least quoting a few lines, though I fear the reference might be lost on most readers. Well, that’s what Google is for. Hint: Michael Jackson. If you figure this one out, you might leave a comment underneath the tree.
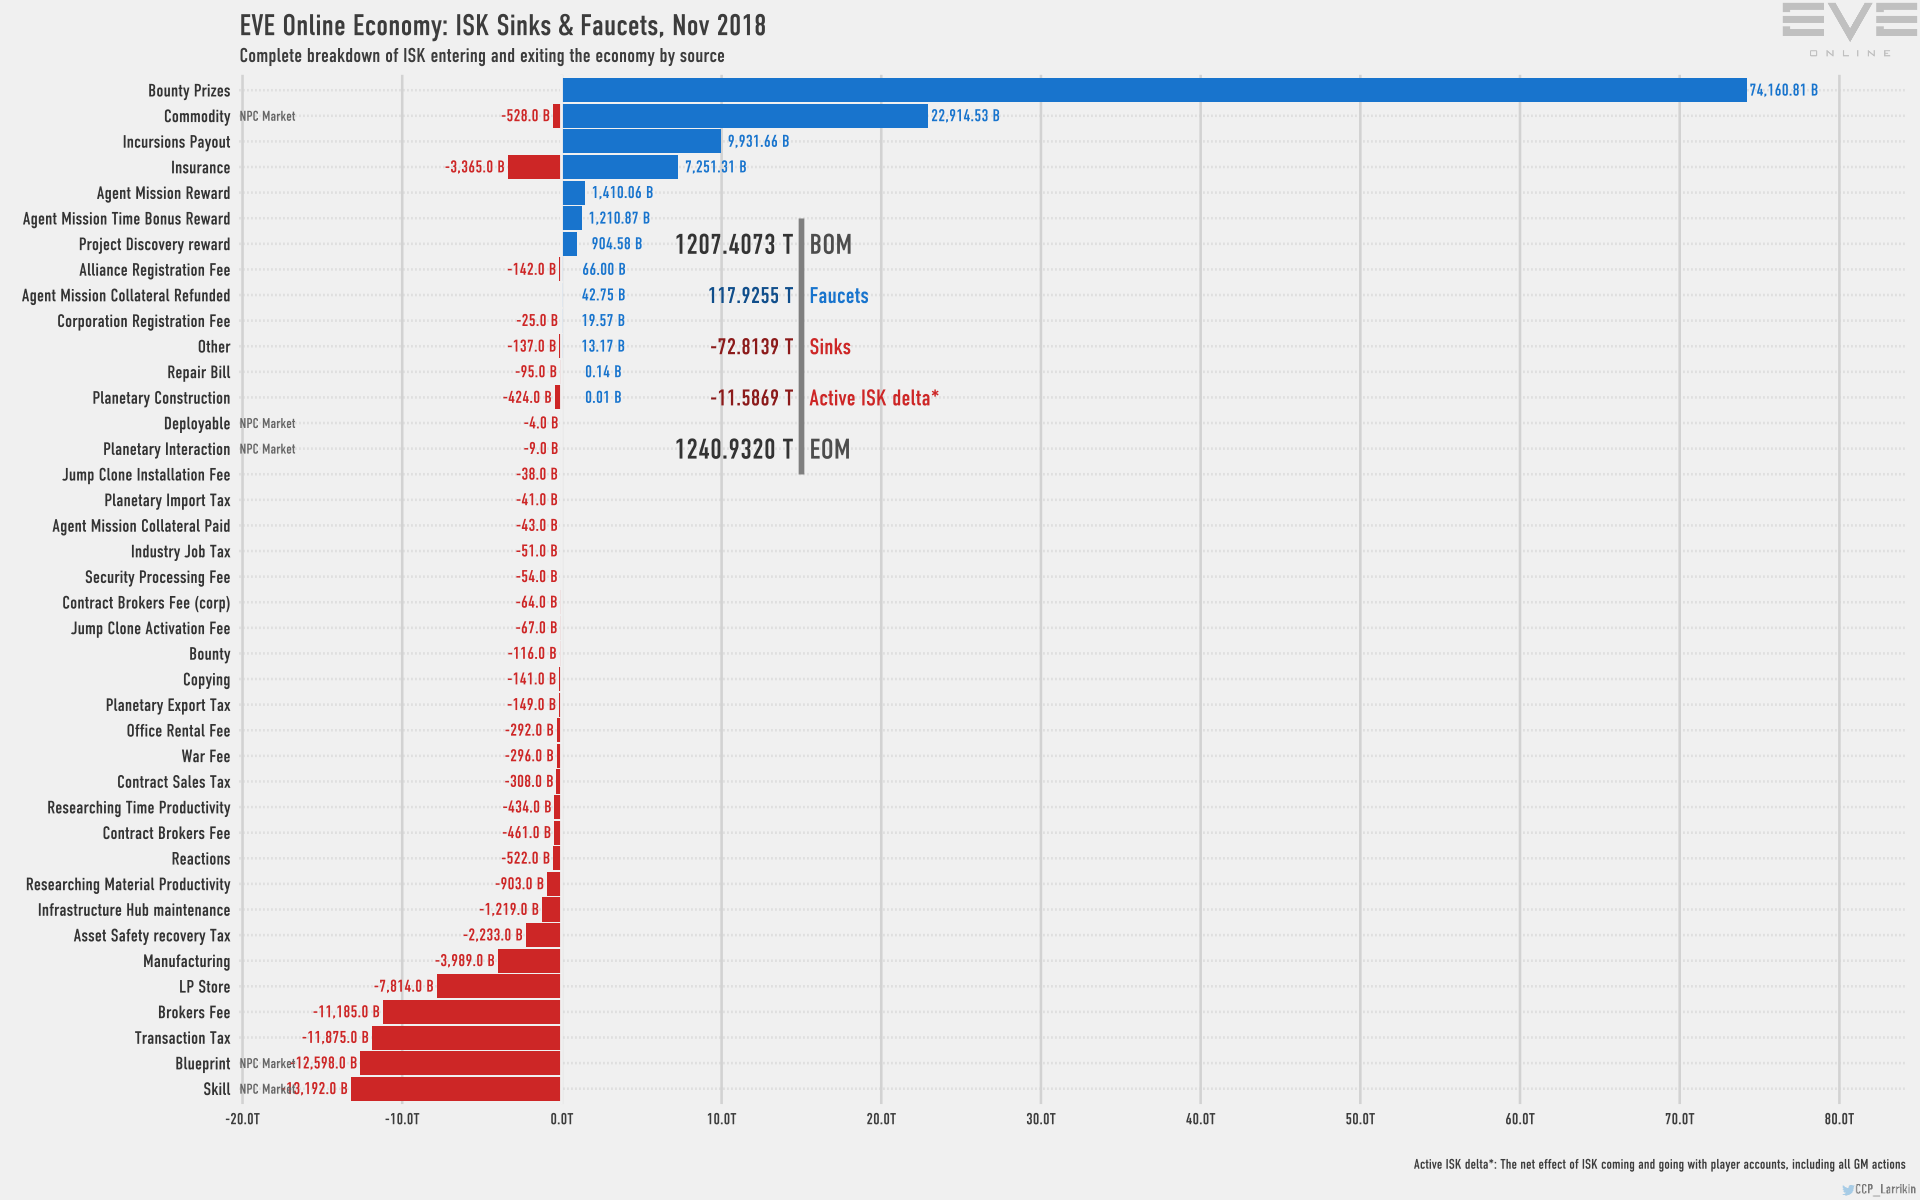
Looking at how EVE players make money, we see that bounties are the greatest faucet by far. Who doesn’t want to spend some holiday time in the presence of rats? The next most lucrative tasks include commodities and incursions. EVE players mostly spend their money trying to get even better, via skills and blueprints. EVE players don’t spend any significant money on things like planetary interaction and repair costs. We see a great disparity, though, between what was spent and what was earned, meaning that EVE players could be saving for some future event. We can see this reflected in the chart showing ISK supply:
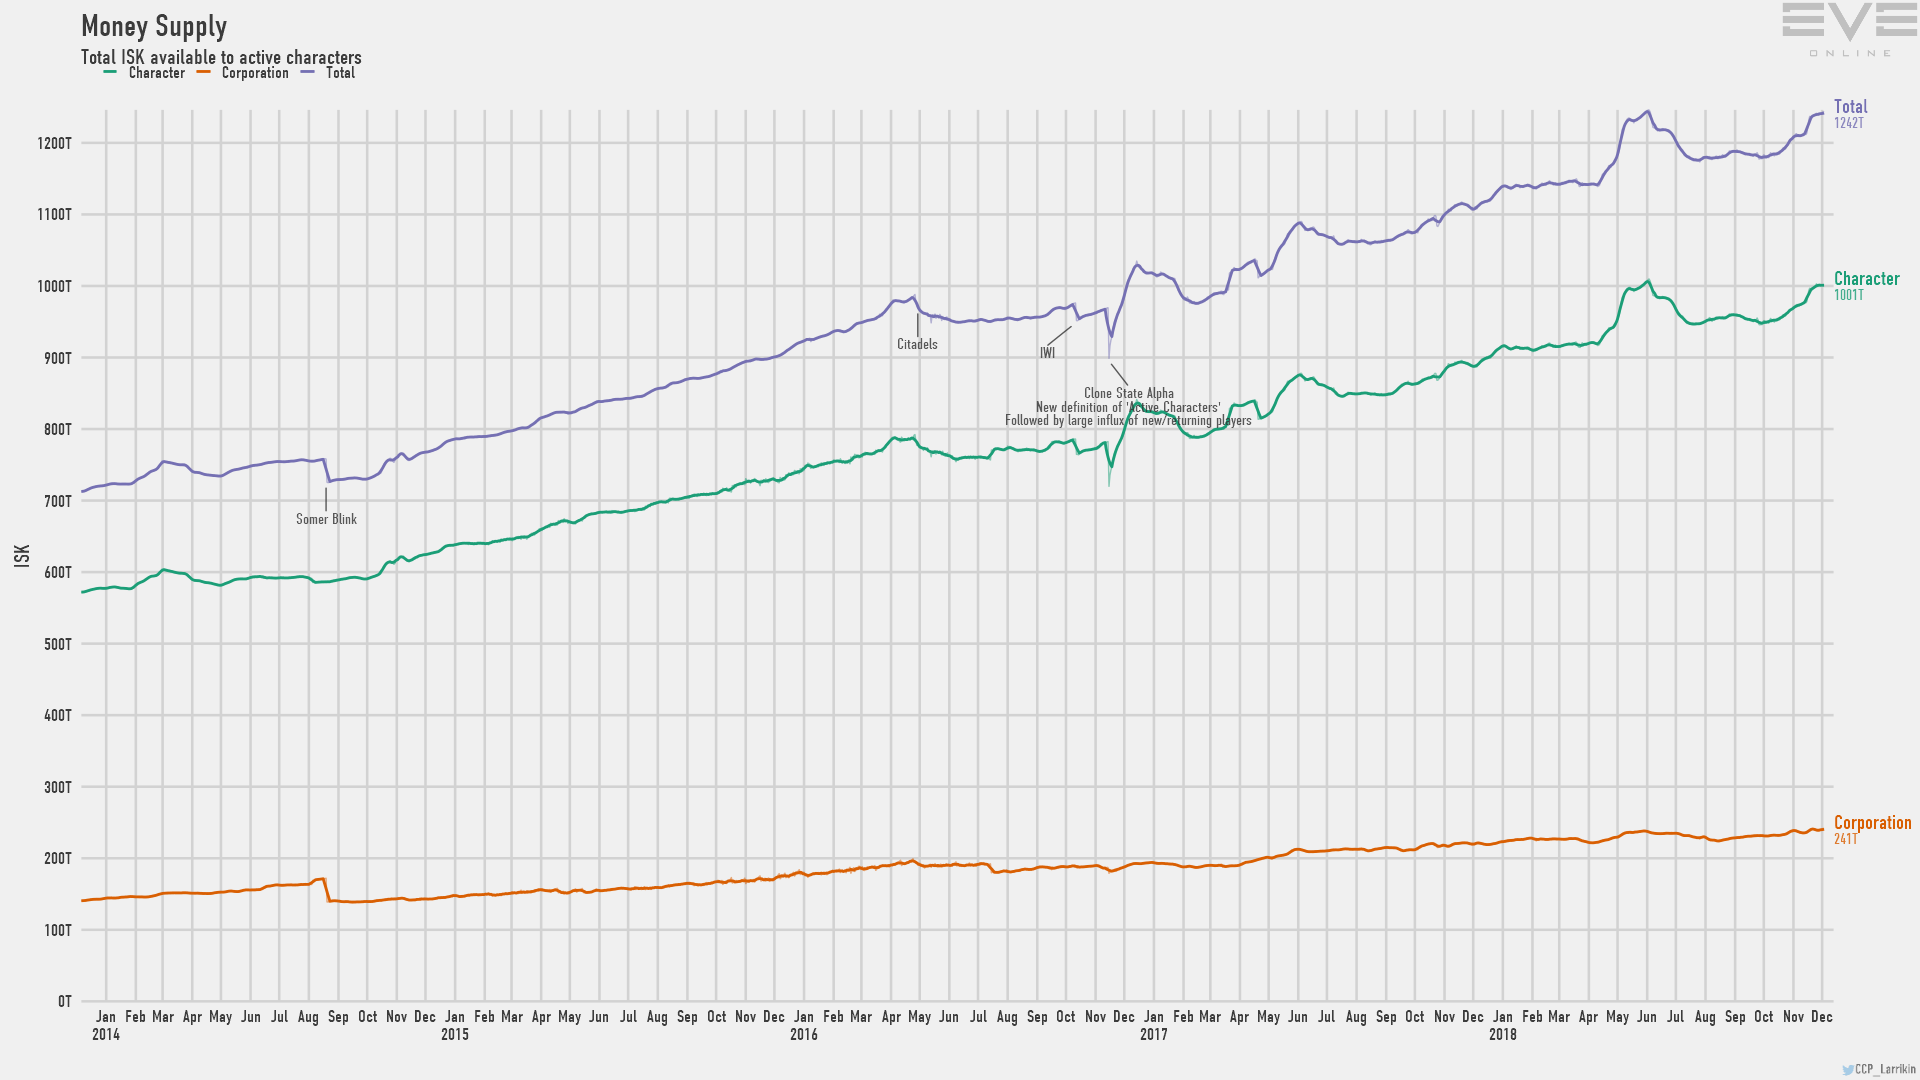
Both corporations and especially individuals saw an increase in spendable money during the past month. EVE players, on average, have a lot more money than they had last year at this time, though corporations only increased their available funds a small amount. This chart would seem to indicate that most corporations are allowing their players to get proportionally much richer than the corporation is getting.
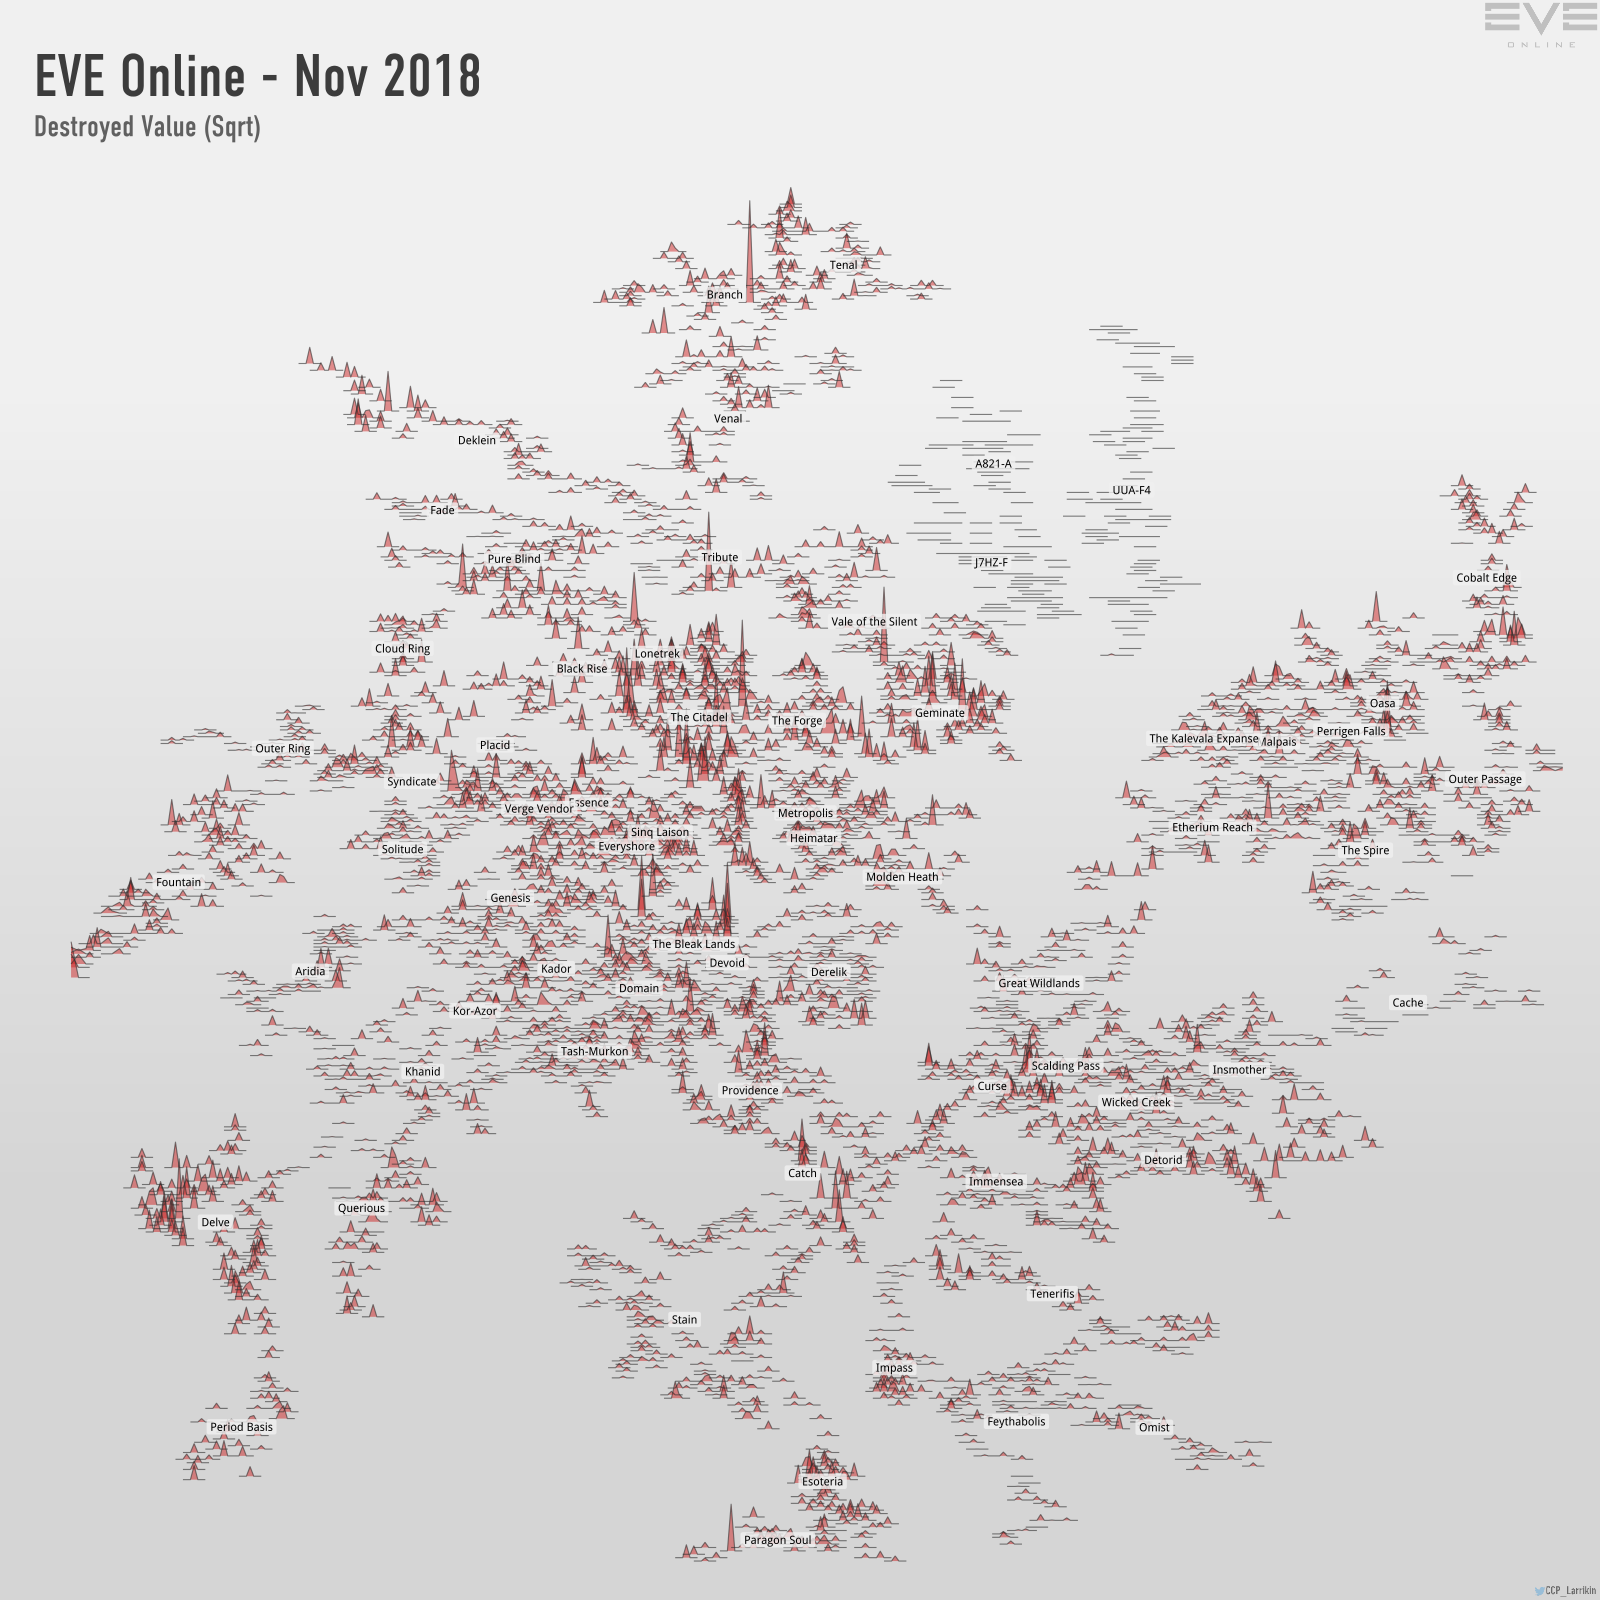
One final small gift, more of a stocking-stuffer, really. Besides looking like a Christmas tree with lights (if you squint your eyes and use your imagination), this nugget shows destruction by value over all New Eden. What I most notice are the large areas of straight lines. We see entire regions where nobody seems to go–empty as the North Pole! It makes me think of Moomin’s article that suggests CCP should delete half the space on the map. Some of it would hardly be missed. And there are straight-line bare patches in many other “branches” of the New Eden tree as well. Perhaps this is because, as Jurius Doctor noted recently, there are really two Eves—null and high, and people from high sec aren’t moving where Bad Santas will shoot their stuff.
I hope the rest of December treats you very well. Enjoy the holidays, everybody!