If you’re looking for the data on the May Monthly Economic Report, stay away from CCP’s website unless you like seeing the HTTP 404 errors…for days.
I usually stay away from all forums because I consider them a half step up from Reddit which just so happens to be half a step from Hell’s inferno. I would never have found the data if it wasn’t for our intrepid Rhivre sending me the link. I picture her, much like my wife, sitting there sending me the link while thinking, “Jeez, Erick, it’s right in front of your face.” Alas, CCP’s Forum is where the full download can be found.
With the data, a database, coffee, Spotify, and Excel at the ready I was off on my journey.
First Impressions
The data is stale. It’s boring, and frankly not all that interesting. It seems as if this effort has become an afterthought for CCP. That may seem harsh but it’s true. Let me temper that with CCP is under no obligation to even give us this data. I am unaware of any other game where players get economic data like this. Then again, few games (if any) have this level of player based economic activity.
Wish List
I’ll start with a short list. EVE’s economic data really should be more robust. Right now we get the data in the form of the evening news. Mining down and ratting up in Delve is the story today. “Delve Continues to Dominate” could pretty much be the headline for the last 5 months. We need some interesting and meaningful data. For example, showing us the “Mining Data in m3 by Region” value in ISK really doesn’t show what is going on. I’ll go a step further why not “Mining Data by Ore Type?”
On to the Data
Delve
The activity in Delve changed a little during May, which traditionally represents the beginning of the summer slowdown for most of the players in EVE.
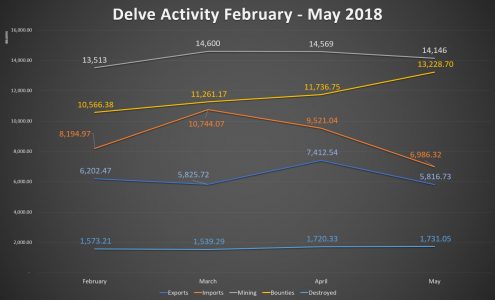
It seems a few of the miners in Delve have taken a break as mining is down a little…Or is it that the value of what is being mined is less? We can’t tell from the data. That’s why we need mining by ore type metrics.
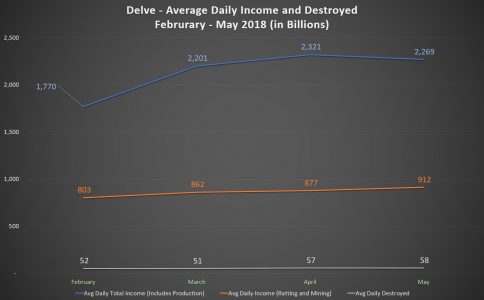
Consistent with an uptick we will discuss later it seems ratting is making a comeback with some strong numbers.
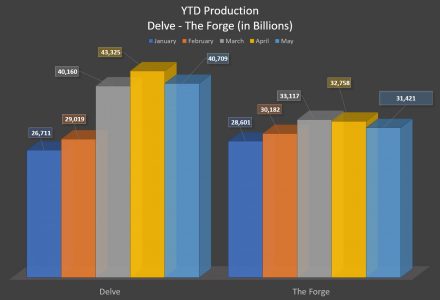
Production shows a slowdown across the two production hubs of New Eden. Delve continues a strong dominance even with the downtick.
Nothing shows the irrelevance of destruction in Delve like this gem of a graph:
Overall Numbers
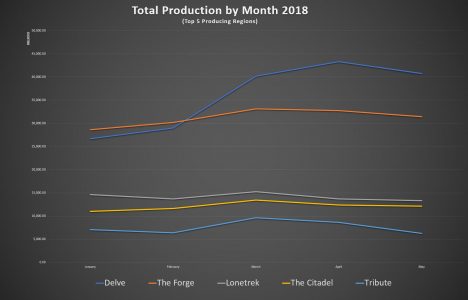
The top five regions for production show an overall decline in total production with The Citadel and Lonetrek showing a very slight decline.
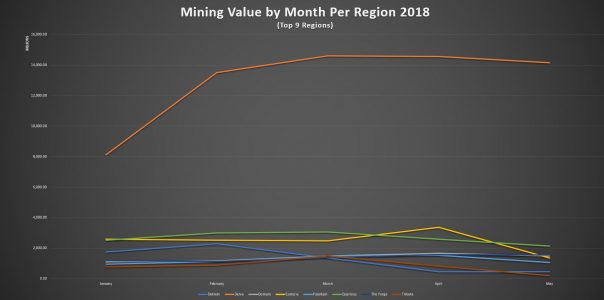
The top 9 regions for mining all show a downward trend. Is this a change in valuation or are players slowing down? Without numbers on player activity, we can’t tell. This is yet another perspective on player behavior that showing the mining data in terms of m3 would bring to the table.
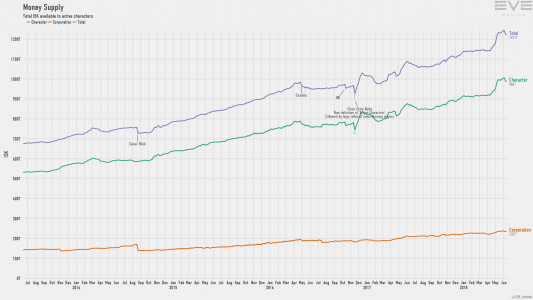
The Money Supply graph was interesting. It shows a sharp increase in the ISK available to active characters. The last time we saw a similar bump we had a knee-jerk reaction from CCP like the end of the world was coming. Time will tell how much of this is due to the recent botting efforts of some. We will see next month if bans handed out for botting will address this increase.
Parting Thoughts
There is no question that addressing some changes in how the data is presented and made available would make life more interesting for those of us who like to parse through it.
Delve continues to be one of those stories like Field of Dreams. If you build it [they] will come. Success breeds success and so on. As I look at these numbers each month I can’t help but wonder. If EVE is losing accounts as so many of us suspect how do we keep posting higher and higher numbers? Is CCP making it too easy to do more with less? Do we just have players so experienced that those who remain can game the system?
Someone once said in a meeting, some years ago at this point, that we were left with the true believers. The evangelists of EVE, so to speak. Is this what we are seeing economically? Is this what Delve has become? Time will tell.