The markets in Eve are used by everyone, whether you are dumping your loot to buy orders, building ships, or trading the weekly price swings. For those who interact with the market for more than instant buys and sells, a key component of their interaction is the market history, which shows you the historical prices for items. There is a problem with this data at the moment, with the values showing in game (and on 3rd party sites) not reflecting the actual history.
Background
There has long been a trimming algorithm on the historical data, which is why those PLEX that sell for 0.01 isk, or 10b isk, do not show up in the data for more than a day or two usually. This is perfectly fine, and stops the graphs being messed up by outlier prices.
The image above is the graph for Tritanium with all the filters turned on. The price looks flat, and is distorted by an extremely high and low price today. The image below is the same graph with the Donchian channel and min/max turned off
The issue with the first graph is caused by the high and low prices in today’s Tritanium price.
A trimming algorithm removes these outliers after they move to historical data, which stops the graphs looking so terrible.
So what is the problem?
The historical data is used for many things, for finding if an item goes to buys and sells for trading, for seeing if the items you build will be able to sell, for speculators looking at trends in prices over time to see if an item is on the way up, or crashing.
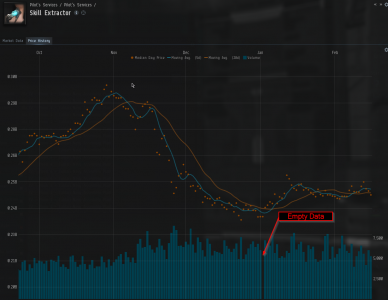
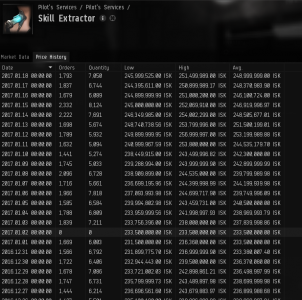
The problem is, that this data appears to be incorrect at the moment. If we take Skill Extractors for example;
This blank day, occurs on many items, on different days, other examples are:
- Integrity Response Drones (25 August 2016)
- Broadcast Nodes (1 September 2016)
- Nanofactory (27 January 2017)
- Organic Mortar Applications (7 February 2017)
- Helium Fuel Blocks (6 January 2017)
- Concentrated Veldspar (8 July 2016)
- Veldspar (10 January 2017)
This, in itself, is not a major problem, it is more likely that it is due to something like the data not being logged for those days than for volumes being inaccurate, however, there is a second problem with the history data which is a little more difficult to explain, but, I will give it a try.
Pricing
First of all, an explanation of the numbers on the price history tab. The orders is the number of instant buy or sell transactions that day, the quantity is the number of items in these transactions. So, if I right click buy 1m Tritanium, it would be recorded as “Orders: 1, Quantity 1,000,000” if I then right click sell 500k Tritanium, it would show as “Orders 2, Quantity 1,500,000” in the price history for Tritanium for the day. The low price is the lowest price paid that day. So with my Tritanium example, if I right click sell them at 5 isk, it would record that as the lowest price (assuming in this example that I am the only person doing anything with Tritanium, or that I have the first transactions after the date ticked over). The high price is, the highest price paid that day, so, if I bought my Tritanium at 6 isk it would record that. The price history tab for the examples laid out above would look as follows:
The average value tells me that there have been more items going from the sell orders than the buy orders so far today. As the average is 33 below the high price and 67 above the low price, it tells me that approximately twice the amount have gone to the high price as to the low price, and that therefore, it is easier today, so far, to sell this item than to buy it.
The low price and high price over time are also useful for tracking trends, and the average will tell you over a given period of time if an item goes to both buys and sells, and in approximately which ratio.
It is in this segment of the price history where outlier removal has the impact, as 0.01 isk PLEX and 1b Tritanium prices are removed here.
Problem
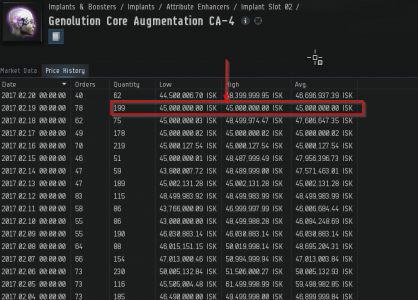
The problem with this data in game, and by extension on 3rd party sites which use CREST history data, is that the pricing information shown is not correct. As with so many other things in this article, it is easiest to show this with images. The first one is for Genolution CA-4 implants, with the highlighted data being for 19 February.
In the image, you can see that the low, high and average price are all 45 million ISK. What this means is, according to the ingame data, in the 24hr period for 19 February, there were 199 CA-4 traded in the forge, all at exactly the same price. This might be the case if no one 0.01’d the item, and everyone who did one of the 78 instant buys or sells did it from the same order. This is unlikely in The Forge, as Jita is there. The next image shows wallet transactions from 19 February for CA-4
This image shows that at least 15 items, on 11 orders went at a price which was not 45 million ISK on 19 February, which does not match with the price history information for the same day.
In the first image, there are several other days visible with low, high and average price all being the same. These are extreme examples, which are easy to spot, and there are many items where you can find examples of this. While for some items, this might be accurate, due to low volume, for high volume items it is incredibly unlikely that all transactions on 1 day in Jita went at precisely the same price.
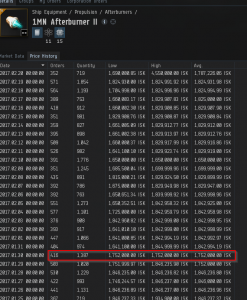
In the above image, the data says that 416 transactions, for 1387 items total, all went at exactly the same price in 24 hours in Jita. That means that no one 0.01’d and only one order was bought from or sold to.
Even without all 3 values being the same, there are multiple entries in the table shown that have prices within a few ISK cents of the high, which again, is very unlikely, and there are other price ranges that are extremely close, so that no afterburners would have gone to buy orders at all on that day if the data is accurate.
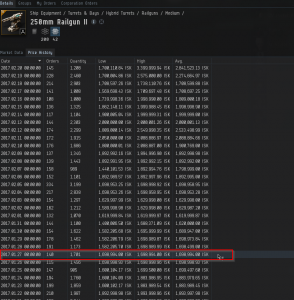
The same type of data problem can be seen on the image above for the 250mm Railgun II, and on most items in the market.
These entries are clearly unlikely to be accurate, but, the problem with the remaining entries is there is no way of knowing whether or not they are accurate. It is easy to say that the extreme examples are inaccurate, but, they may just be the ones that are easy to spot. Without keeping a record of the “Today” entry on the price history it is difficult for us as players to know whether or not these values are correct.
The reason for these errors are unknown, they have been present in the price history for at least 18 months, but now the data has got to the point where it is fairly difficult to see whether an item goes to buys or sells with any degree of confidence. This is not problematic for experienced traders, who already know that for example, high volume T2 modules do go to both buys and sells fairly evenly. For newer traders however, this obfuscation of data creates problems for them when trying to find items to begin trading with. It also creates problems for people who are trying to look at trends over a period of time using the graph, or 3rd party tools which display price history.
It might be that the trimming algorithm for removing outliers is being overzealous and cutting prices that are not outliers, or that some other calculations are throwing out the prices, but, whatever the reason, as it stands at the moment, the market history ingame, and the CREST history data are not something that you can rely on with any degree of certainty. Hopefully, this is something that CCP are able to fix soon, as the economy is one of the unique features in Eve, and many players use the data in various ways for their activities throughout New Eden.


