[WARNING: CONTAINS GRAPHS]
On August 23, CCP finally released the July Monthly Economic Report. Here at INN, we have been discussing doing an in-depth quarterly report to give perspective on the MER, but in light of the changes that are happening with Eve, we thought we would do a deep dive on the year-to-date this month, then pick up in September/October for the next one.
So, let’s get started with what has been going on:
On June 25, there was an outbreak of Drifter attacks in Nullsec. July 12: the Nullsec Blackout came in to effect, where local was removed from Nullsec areas.
In a Talking in Stations interview on July 26, Hilmar said “[The] ISK faucets and sinks are out of whack, there is way too much ISK in the system, the velocity of money is not high enough. There are a lot of fundamental economic problems that we are going to be addressing. So expect a lot of changes coming up.”
August 16, CCP Rise went onto Talking in Stations to discuss the ongoing changes in greater detail, and said in answer to a question about the economic state of Eve: “6 months ago, we were especially focused on [the economy] because the resource and ISK faucets were getting really out of control and so they needed intervention. “
Carneros followed up with a question about whether the economics was one of the key performance indicators they were tracking, to which Rise replied: “[We are] definitely still tracking [those metrics], but we are out of the woods when it comes to the scary faucet situation we were in. It should be fairly easy for you guys to see that the amount of PVE in all forms has gone down in nullsec, and with the market tax on top of that we are completely out of the woods. With this latest change, we are going to be looking at where to tune rewards back up to where it is worthwhile for people to be out gathering resources and shooting rats, because we are going to be in [an economic] deficit.”
So we know that CCP are concerned about the sinks, faucets and money supply in Eve. Their statements, combined with the overall interest in the effects of the Blackout, have meant that this MER is one of the most eagerly anticipated in years.
Looking at an MER month-on-month can give strange impressions, due to events like wars impacting any single months data and distorting any change. We will run through most of the info from Spring this year (where bounties were at the highest point in the last 2 years), and use some 2017-2019 data for longer term comparisons. Prior to 2017 data becomes a bit weird, because Injectors came in during February 2016, Citadels came in April 2016, and these things fundamentally shifted key aspects of Eve.
Back to Basics
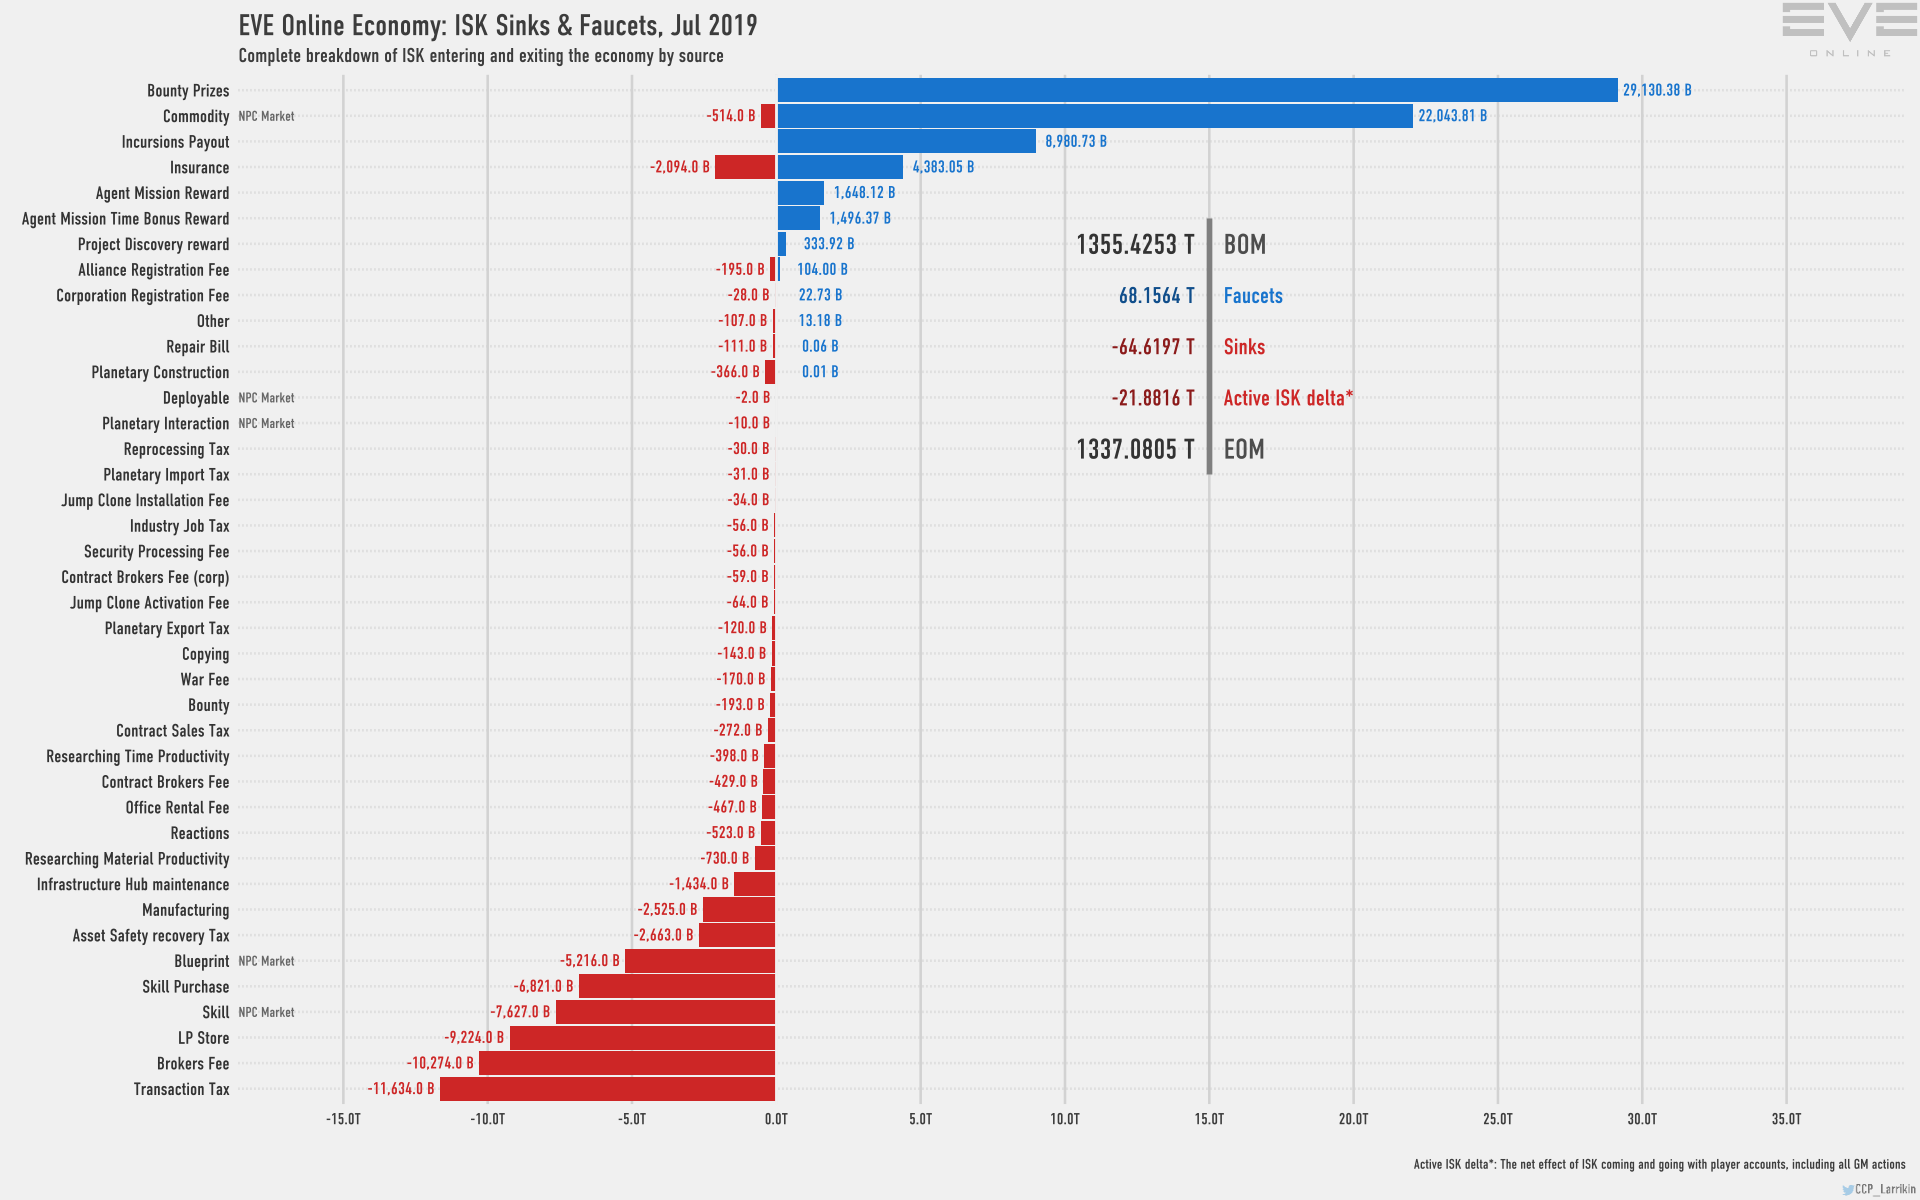
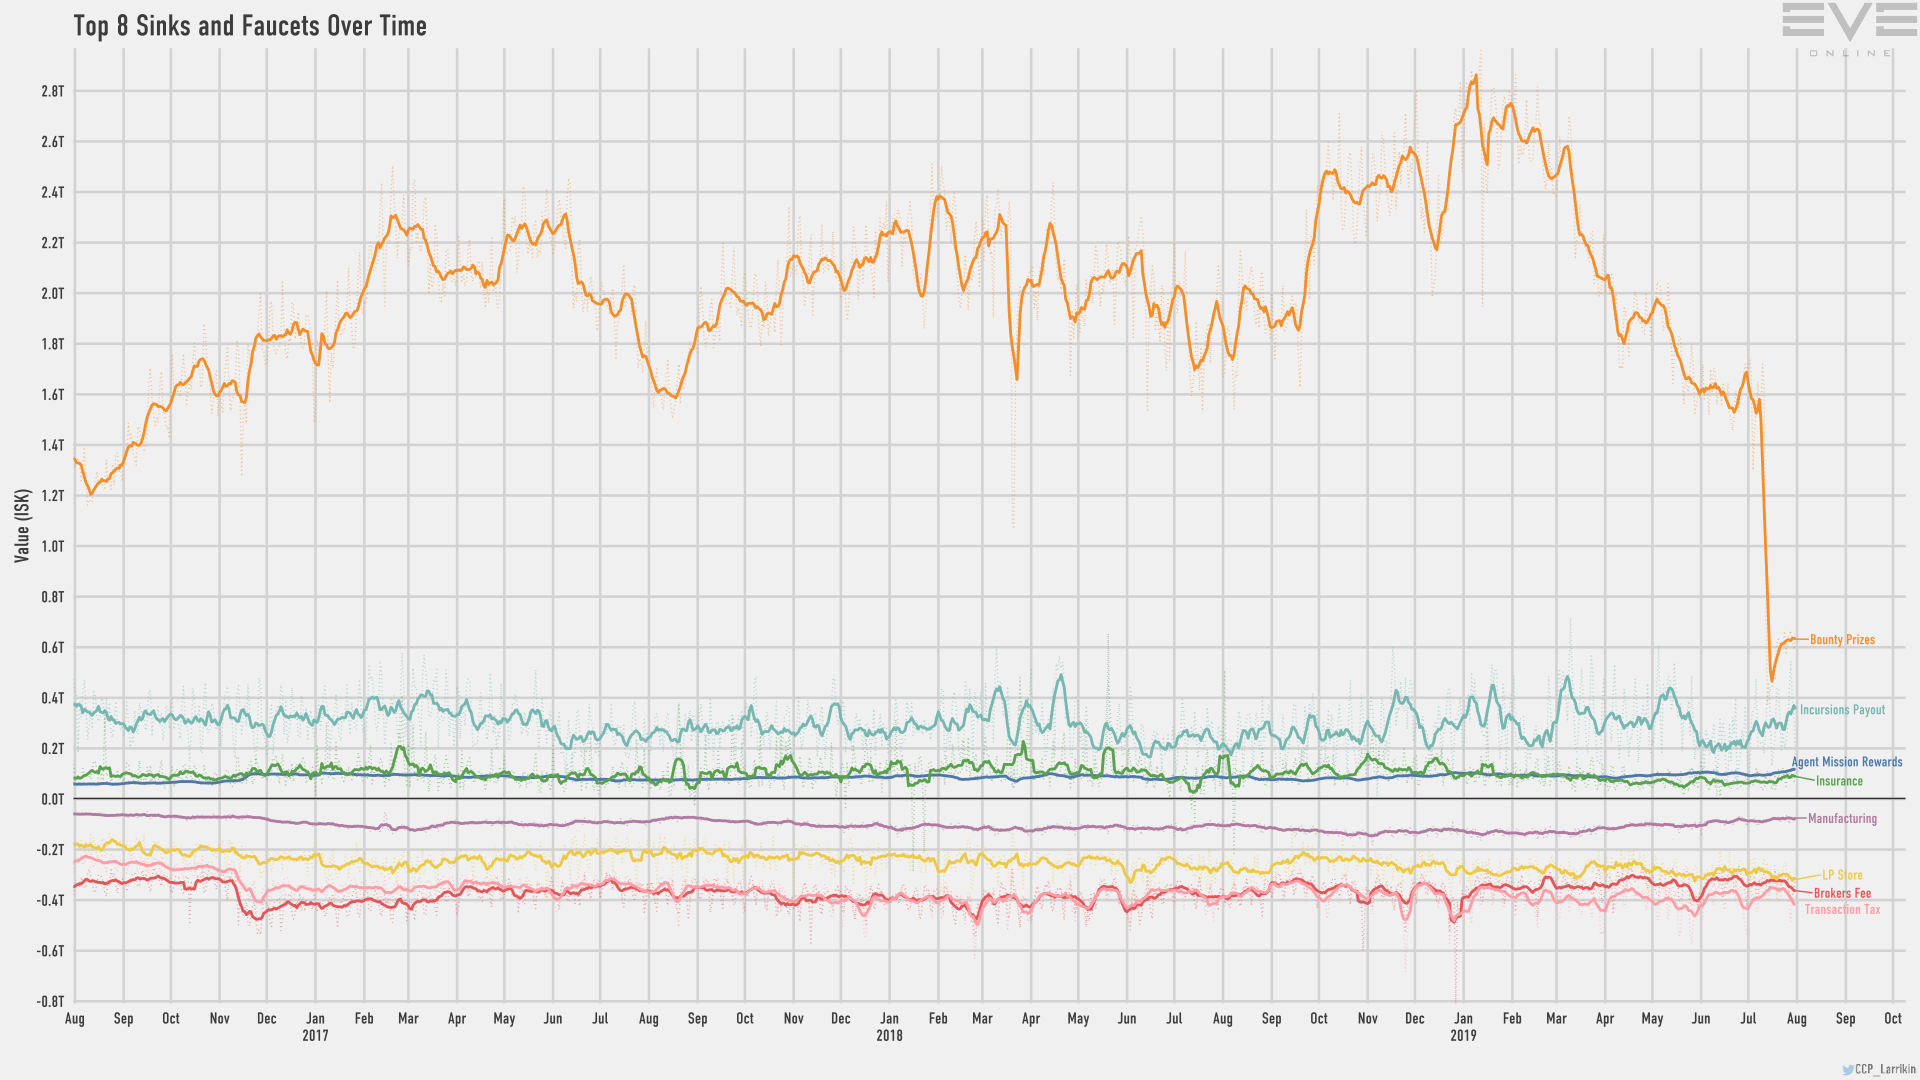
Hilmar mentions sinks and faucets being out of whack, and Rise says that they were out of control earlier in the year. The faucets hit a high last October, and continued rising until January 2019, when they began falling. Faucets are ways in which ISK enters the system in Eve, and the primary means for this is bounty payouts, commodities and incursion payouts. You can see them on this image in the MER.
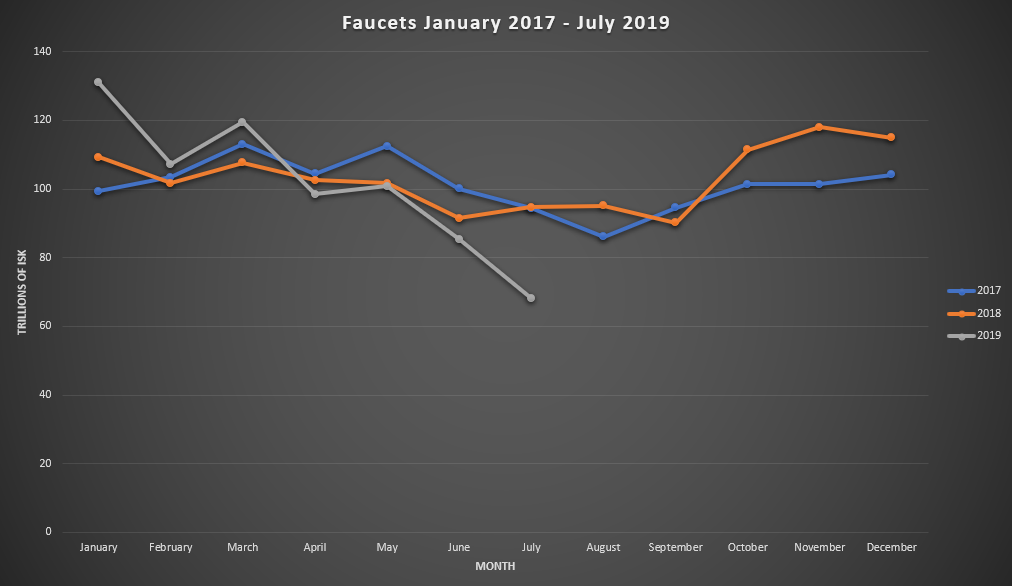
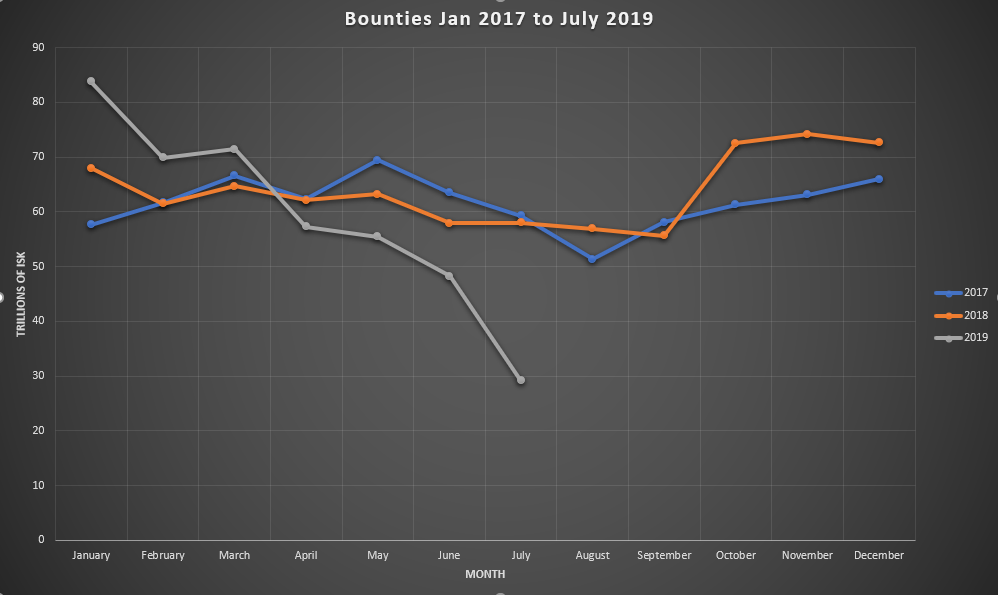
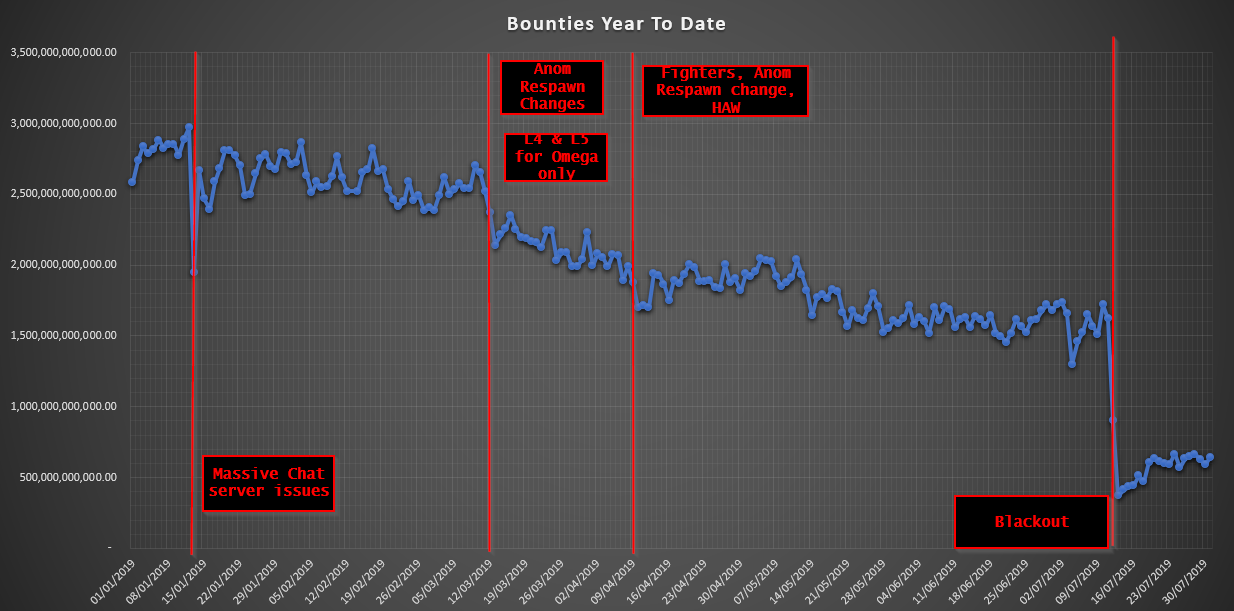
Earlier this year, CCP made changes to reduce the income from ratting. In March, the spawn times increased for anomalies in nullsec, reducing the rate at which they could be farmed. In April there was a change to fighters and the Networked Sensor Array. There were also changes to High Angle Weapons. All of these contributed to reduced bounties, but there is an underlying downward trend without these. The two previous graphs are monthly data points, but there are charts available with daily data points.
The reason for using daily data over monthly is that it makes it easier to pull out trends and events. You can see on the daily data for example, when the chat servers were experiencing massive issues: on January 13, the daily bounties drop by approximately one trillion ISK. This rebounds rapidly because the chat issues resolve to some degree, and also because people are aware that issues will be short-term. When the blackout hits, you see a 1.3T drop in bounties per day, which recovers to just around 1T below pre-blackout levels. It is expected that August ratting values will be lower than July, as people realise that the blackout is staying, and find other activities to do especially if they are subcap ratting. With cyno changes coming in September, it could be expected that ratting will also drop in that month.
The blackout is clearly visible in the graph above, but we will get to that shortly. For now, I want to show you the other component that Hilmar and Rise have expressed concern about. Faucets do not exist in isolation. There are also sinks in Eve, mechanisms by which ISK exits the game. These are primarily the Sales Tax (or as CCP call it, Transaction tax), Broker Fees and the LP Store. The chart below shows the delta of sinks and faucets since 2017. This was calculated by taking the faucets and sinks values provided in the MER and subtracting sinks from faucets. What this shows is how much extra ISK comes into Eve each month (or leaves if the delta is negative).
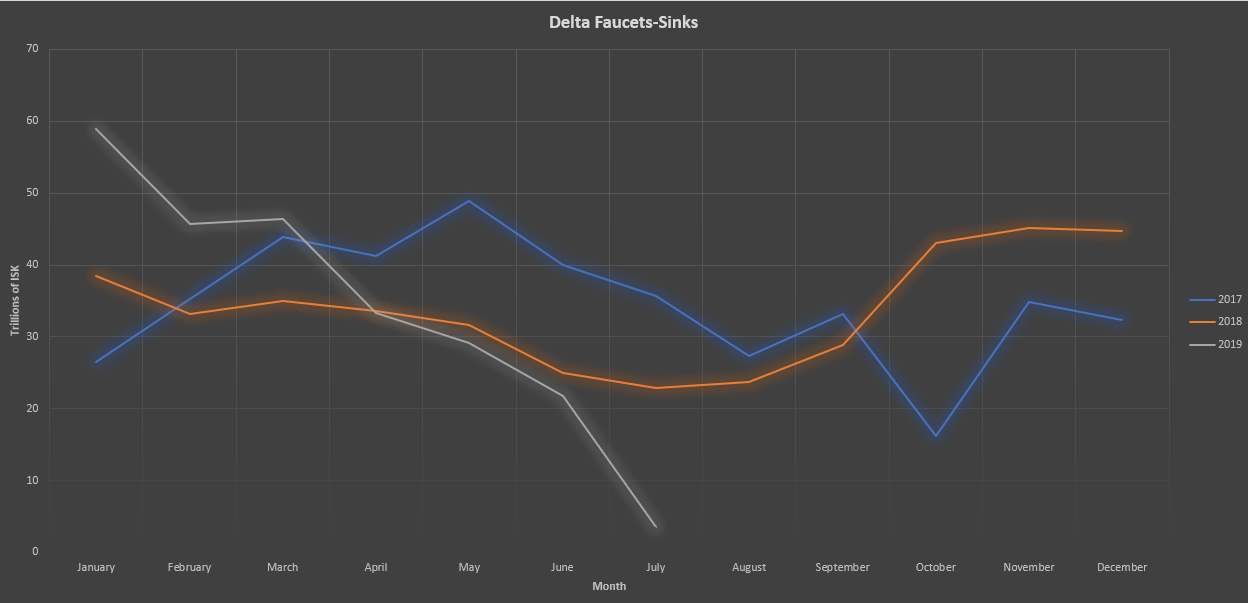
This shows a trend in 2018 and into 2019 where there was a lot of extra ISK entering the economy each month. The sharp-eyed among you will have noticed that this roughly follows the faucets trend, meaning sinks have stayed somewhat stable during this period. This makes sense because Sales Tax, Broker Fees and LP store purchases are not expected to massively fluctuate during the year. You can see that as the bounties began to fall this year, the gap between faucets and sinks begins to close, hitting 21T in June, and just over 3T in July with the massive drop in bounties from the blackout. This is before the transaction tax changes come in, they did not start until the end of July. With reports of ratting dropping off heavily during August even compared to July, and the massively increased transaction taxes and broker fees we can expect to see this become negative in August, meaning that overall, ISK begins leaving the system.
It should be noted that sinks are spread across the entire player-base, whilst faucets go to a subset of players (Those running missions, incursions, and ratting).
Below the asteroids
Ok, so, now we have looked at the big picture. Sinks and faucets were out of balance, but now are balanced and likely to go to negative in the next month once the market fee changes kick in. This is backed up by what CCP Rise, and Hilmar have said, that there will need to be tweaks to faucets to encourage people to go back into space.
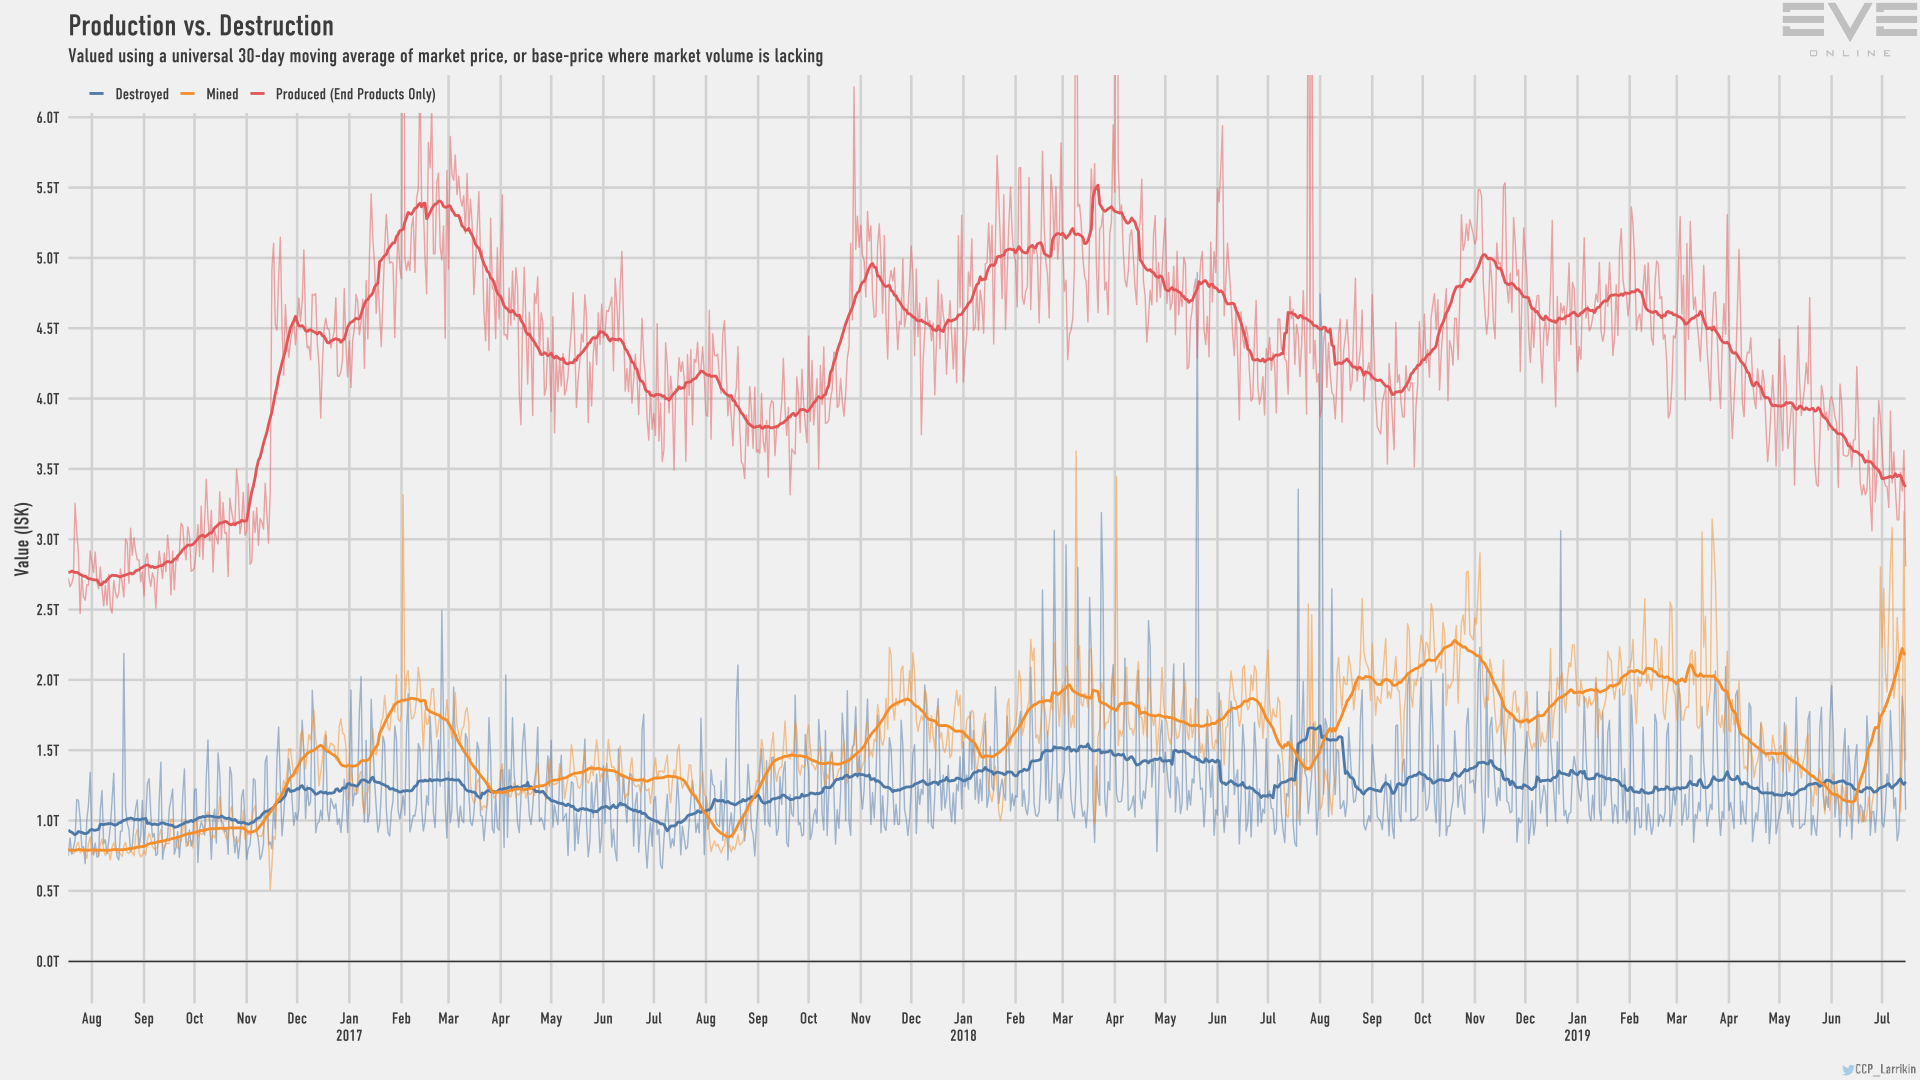
Now lets take a look at the other parts everyone is interested in! Firstly we will take a look at the mining, production and destruction graph, so buckle up for a wild ride!
The mined value is calculated on a 30-day moving average. The chart below is the value mined from May 1 to August 18, so it covers just over a month after the blackout.
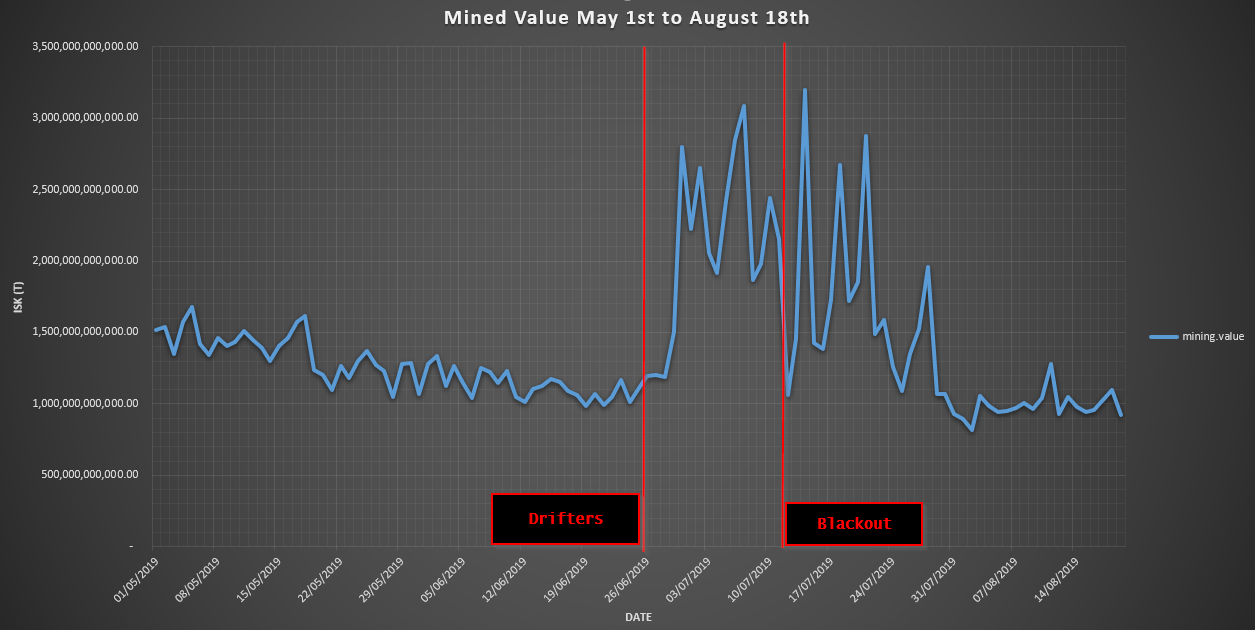
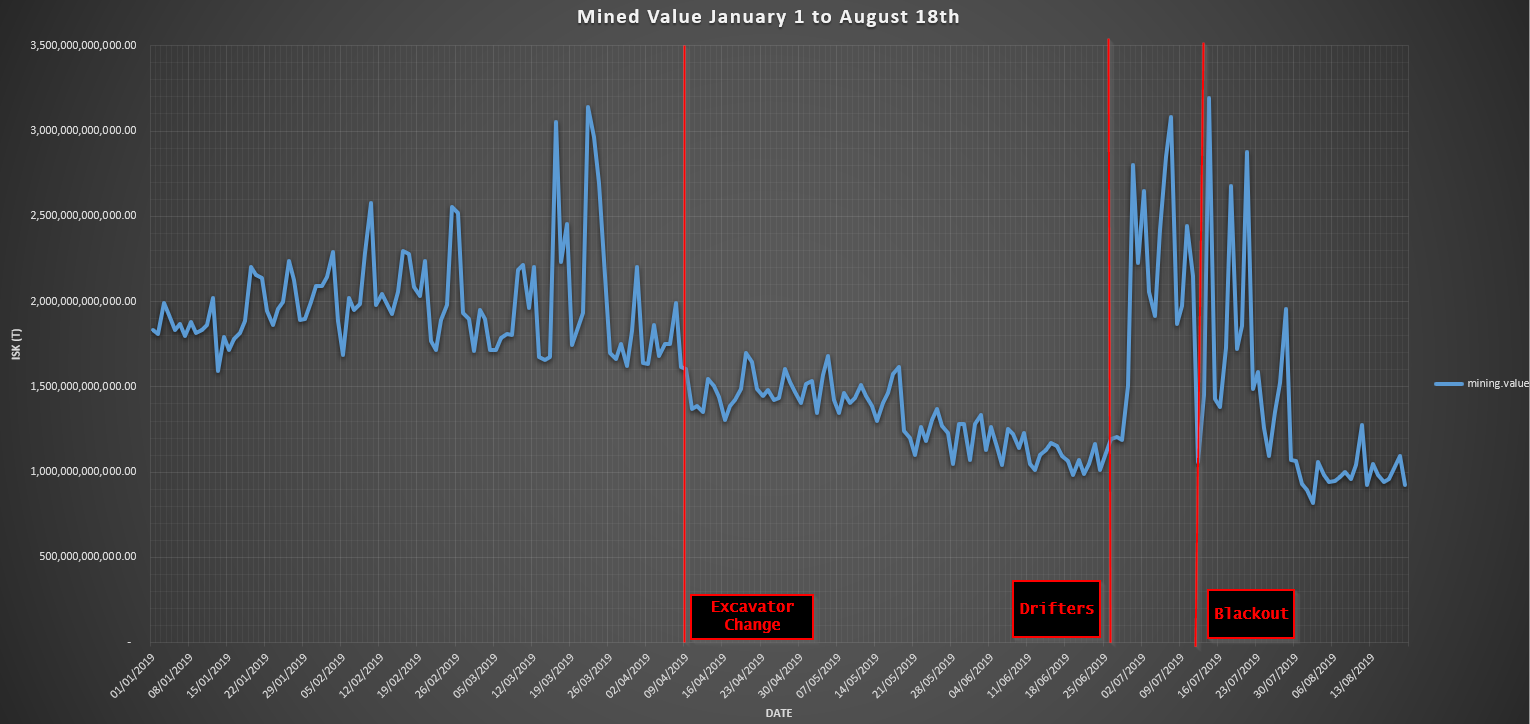
The spike indicates an uptick in activity, which correlates to the Imperium undeploying when the Drifters came out, and then there are fleets run just after the blackout. Other regions have also seen an uptick in mining, which we will see later in the article. At the end of July however, mining returns to the values it was at pre-Drifters and Blackout. If you include data from January in the chart, the long term downturn in mining, similar to that in bounties, can be seen. The reason for the levels staying higher than with ratting may be that more people in null mine in Rorquals than in barges, and Rorquals are safer to be out in space with due to their PANIC module. With ratting, there are a large number of people who fly subcaps, so if they reduce their ratting, the bounties drop off significantly. The cyno changes in September would be expected to reduce mining, and I expect to see a drop in mining for the remainder of August for the same reasons as ratting.
There are two other sets of numbers on the same chart: the production values (for end products only), and destroyed value. I know that everyone is interested in the destruction, so we will take a look at it.
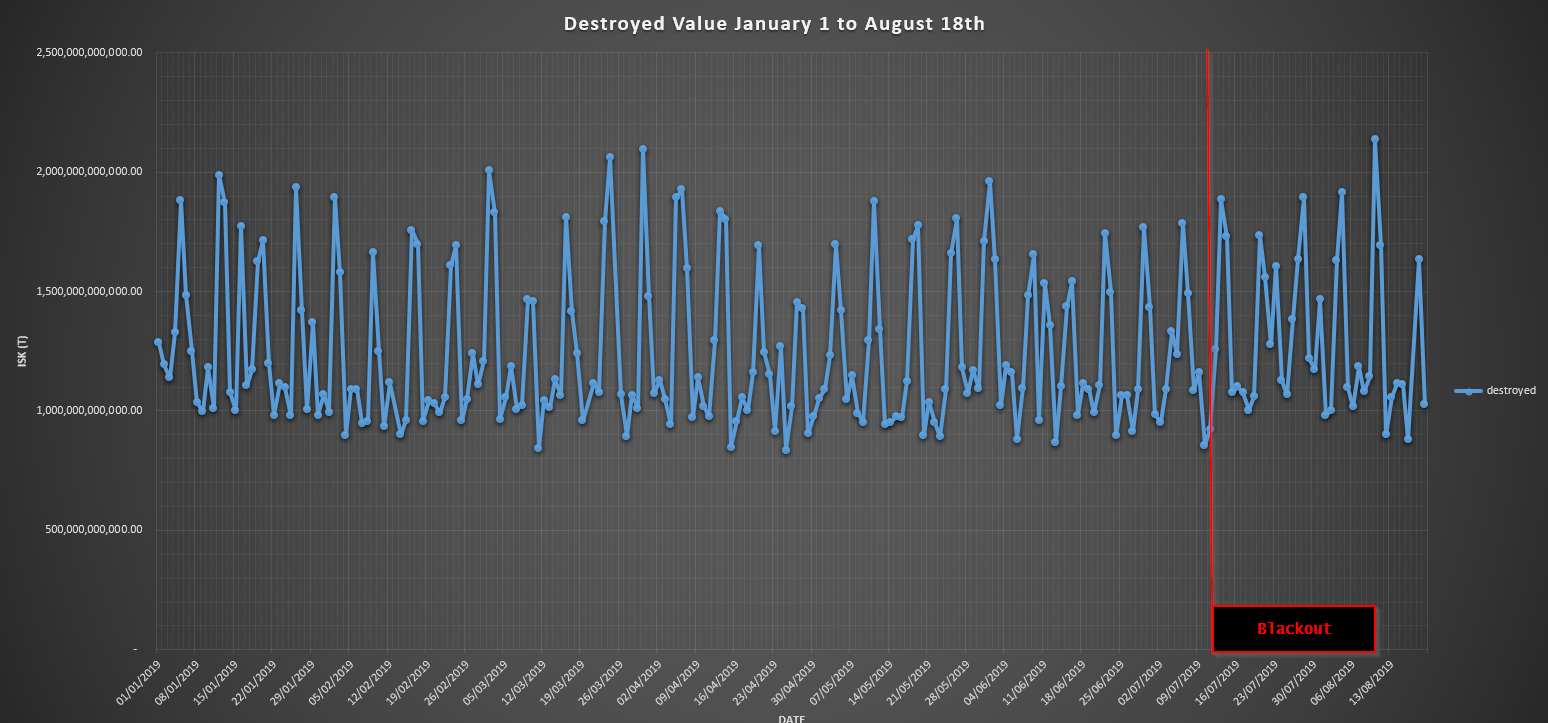
I will admit, I was expecting to see a slightly different pattern post blackout. What we see is a clear weekly pattern with destruction peaking each Sunday, and dropping off during to a low on Tuesday and Wednesday before rising back towards the weekend. There is a busy Sunday on the August 10, but I was expecting to see more destruction post blackout. What this means is uncertain. I would have thought that there was a rush of hunters out and about in null post blackout catching easy prey without local. The data here does not bear that out. It could be that the hunters were finding it harder to locate prey, or there were fewer prey for them to find.
Excavators massively increased in both the number, and the value destroyed in July. In June, 225 were killed according to Zkill, in July that number was 1744 and so far in August we are at 1107 destroyed. In terms of value the losses increased from 120B in June, to 917B in July, and so far in August 600B. Rorqual deaths however, have decreased.
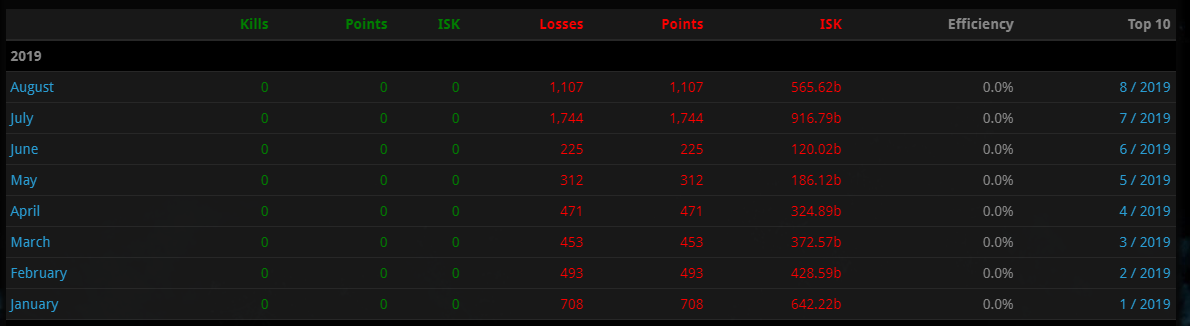
Excavator Statistics – You can see the Blackout losses compared to previous months.
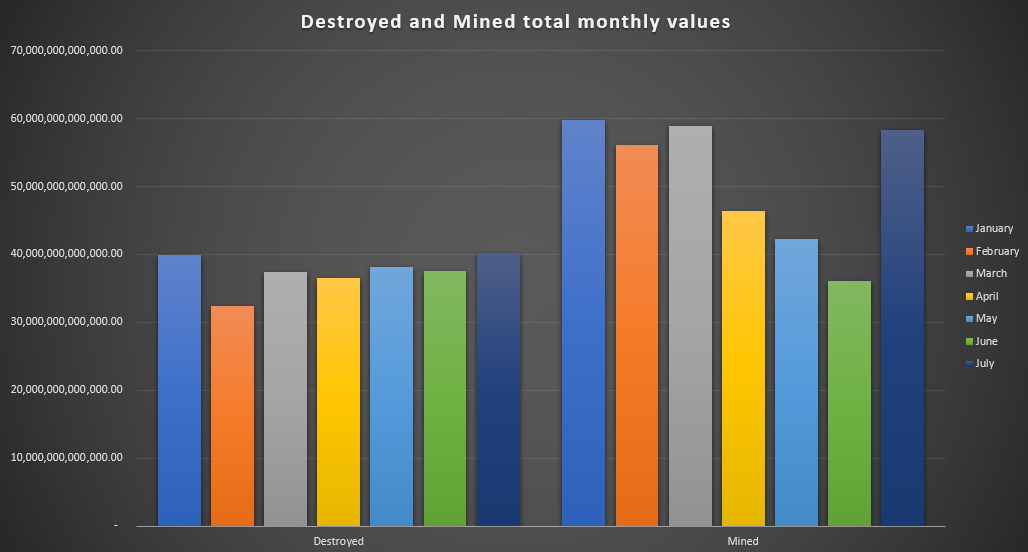
The two charts above are plotted daily, so it can be difficult to see the monthly picture. I have put the monthly totals from mining and destruction onto a chart below for a quick and dirty overview of the situation. What we can see here is that destruction increases by approximately 3T in July (37.6T in June to 40.2T in July). The mining value has increased from 36T to 50T, of which approximately one quarter can be accounted for by an increase in one region (As we will see in a bit).
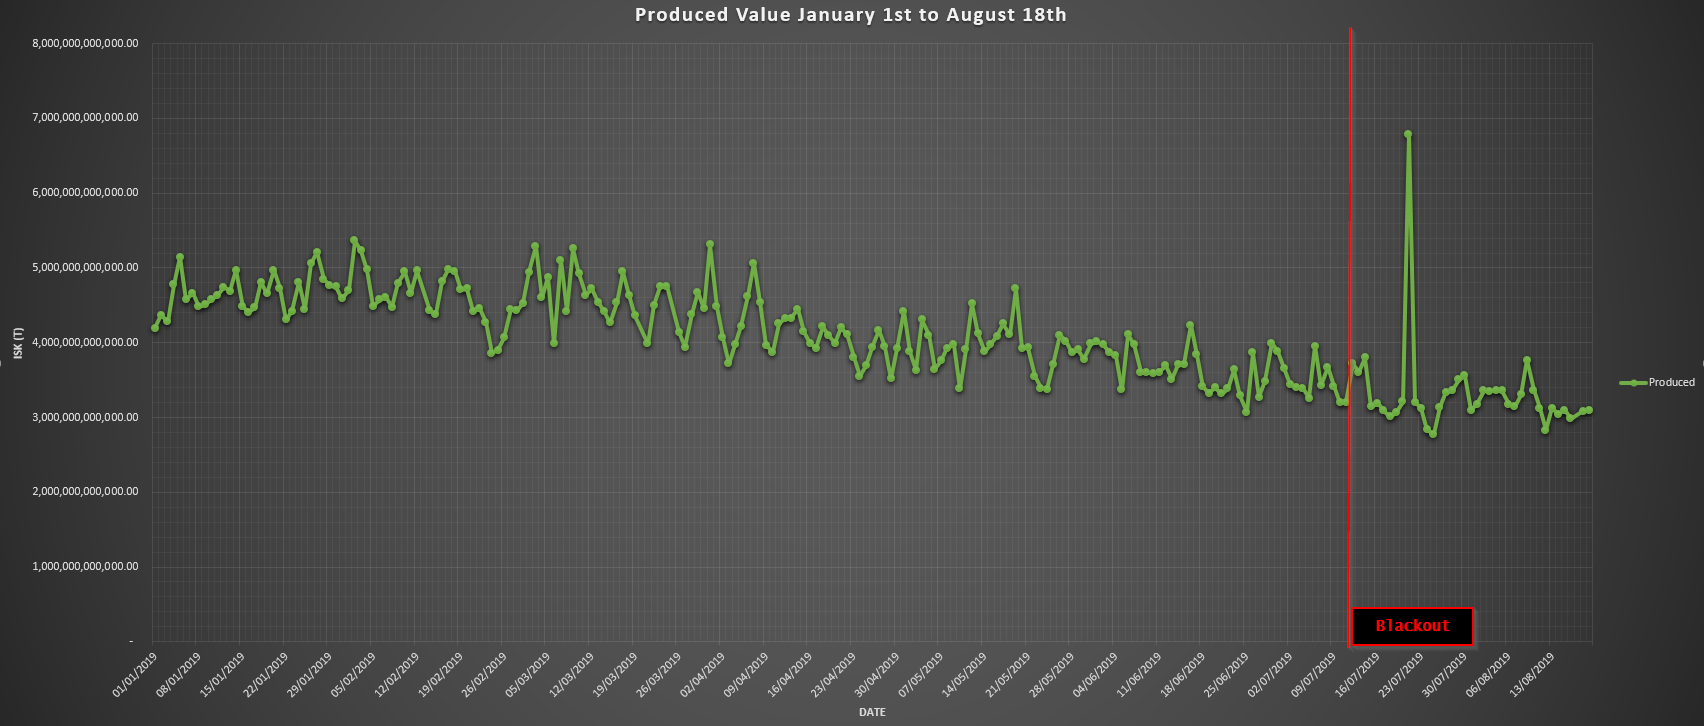
The final set of data that we have going into August is the Produced data. This shows little impact from the blackout, but there is an interesting 3.4T spike in production on July 21, which I will leave for you to figure out what it was.
Delving into the details
Now the most exciting bit of all! Let’s take a look at who, and what, has been most impacted by the blackout. We will start with everyone’s favourite region, Delve, and look at the data since March. I am using March – July here because the changes impacting anomalies began to come in during March.
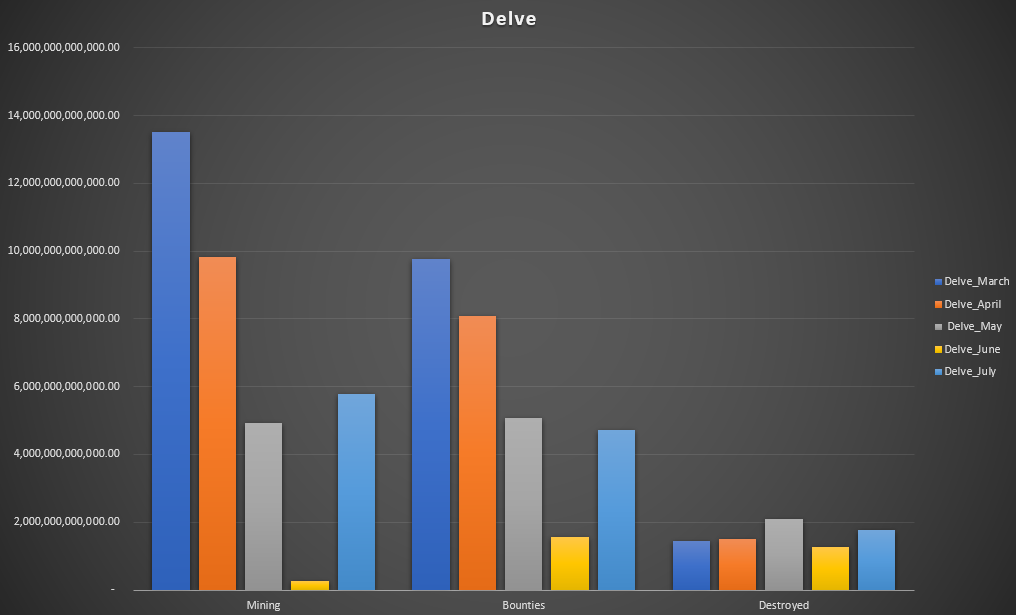
There is a significant drop-off in mining from March to April, as the excavator changes come in, and the decrease in May follows the overall trend for bounties and ratting that we saw earlier. June is where the Imperium was deployed to Tribute for a month. In July we see mining bounce above May levels, and ratting is slightly down on May (300b decrease, from 5.09T to 4.71T). Destruction has not majorly changed over the period shown above. June was higher in proportion to the other activities, due to the Delve hunting groups that were down while Tribute was under attack.
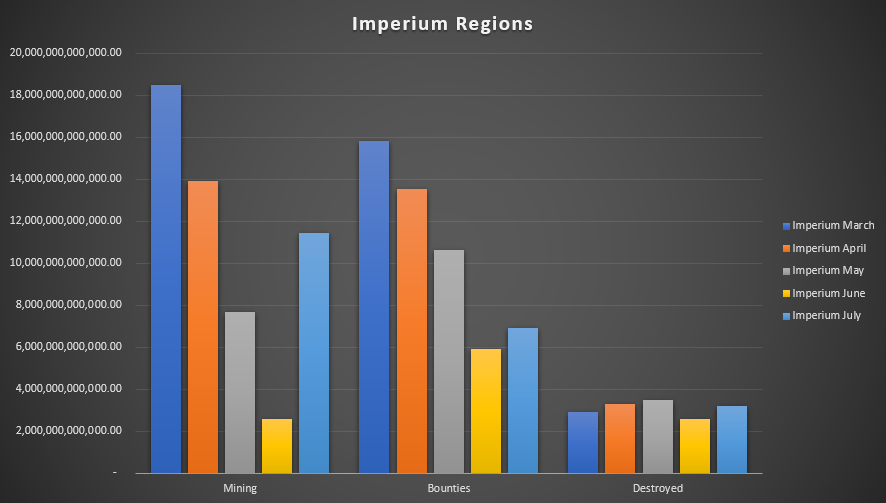
Looking at Imperium regions as a whole (Delve, Fountain, Querious, Pure Blind), there is a 9T increase in mining, a 1T increase in bounty income and a 700B increase in destruction from June to July
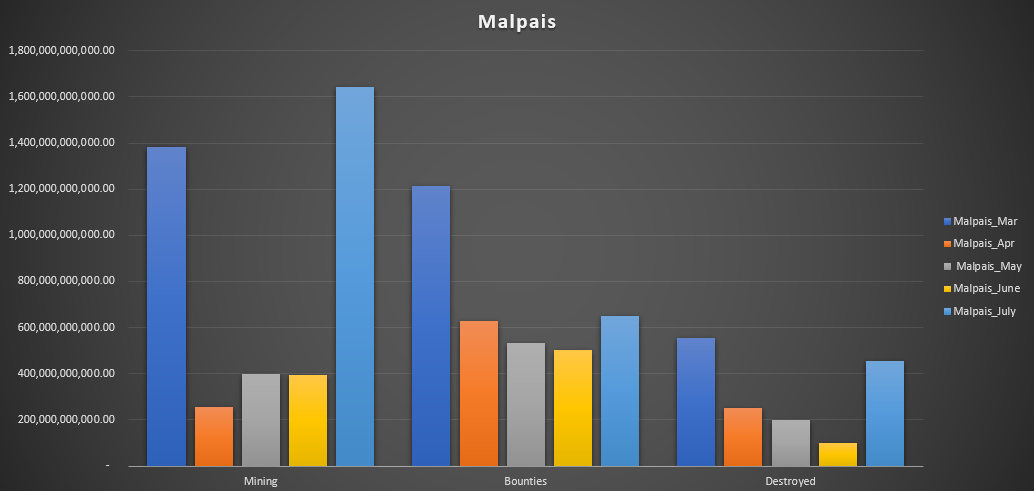
Talking of Tribute, Panfam relocated from Tribute to Malpais during the June incursion from Imperium, and you can clearly see this on the data. The mining drops from 463B in March down to 28B in July. This is a 4B increase on the amount mined during June. Bounties are down from 760B in March to 37B in July. During the invasion bounties were at 108B.
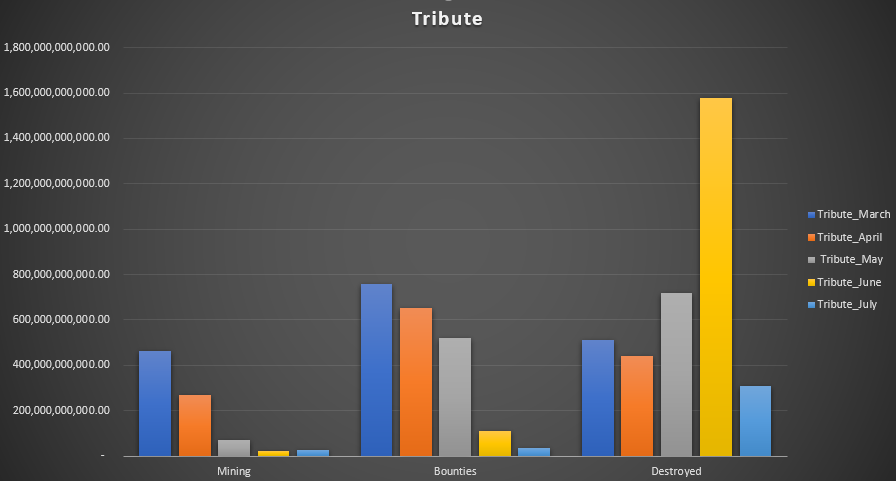
The graph above is distorted a bit by the destruction during the Imperium visit, so removing destruction shows the development of mining and bounties more clearly.
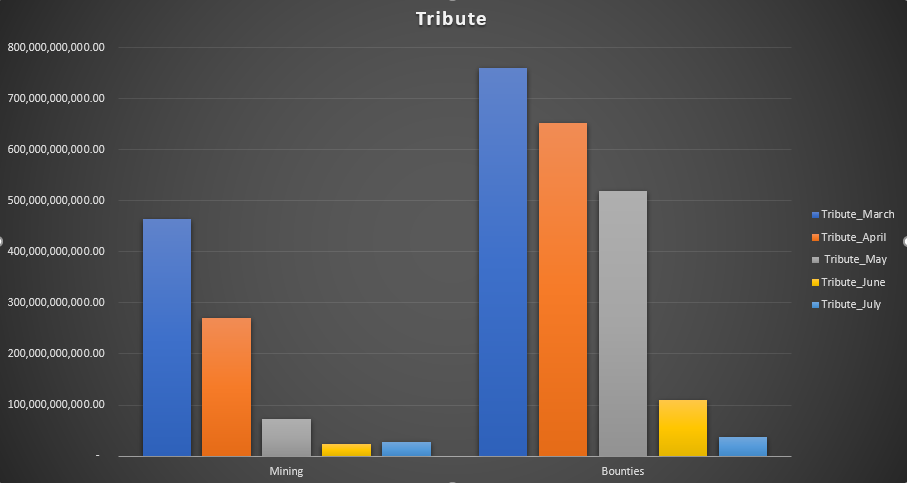
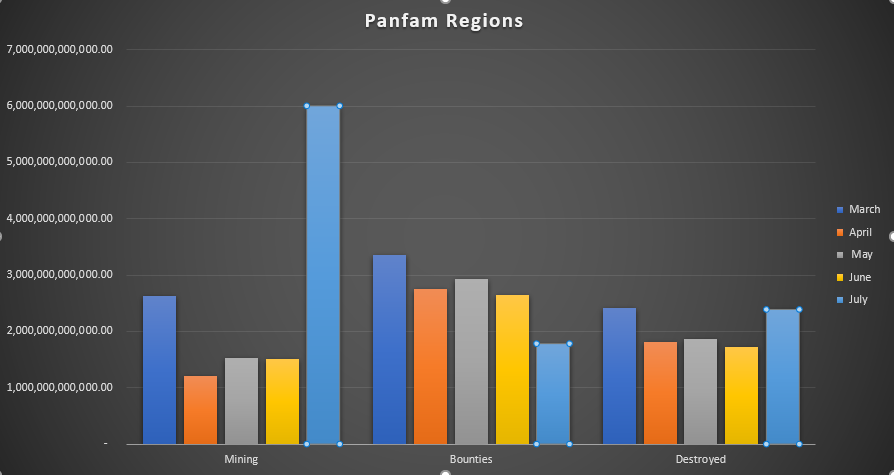
Panfam relocated primarily to Malpais, and you can see this reflected in the changes in activity, despite the blackout. Taking the regions Panfam are living in (Malpais, Geminate,Etherium Reach and TKE) as a whole, the change in mining as they move in are clearly visible. The drop in ratting is not significant for the regions over the past five months, but when you consider that the entirety of PanFam have moved there, it represents a large drop-off in activity.
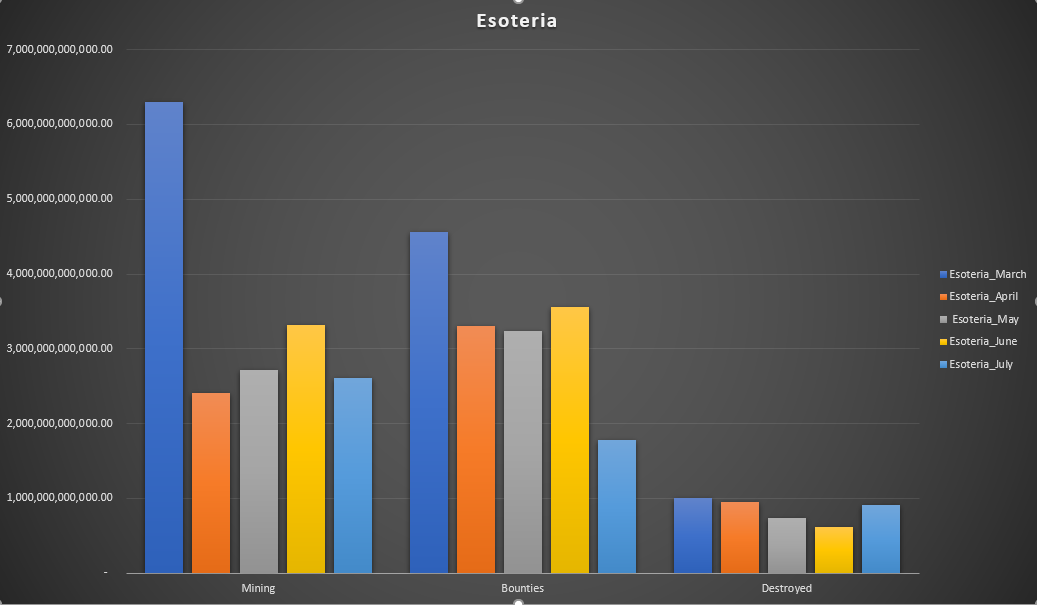
Esoteria is where TEST live, and they have had a drop-off in all PvE activities compared to pre-blackout levels. The mining is least affected, being closer to the May value, while the ratting has (in common with most other regions of nullsec) seen a large decrease.
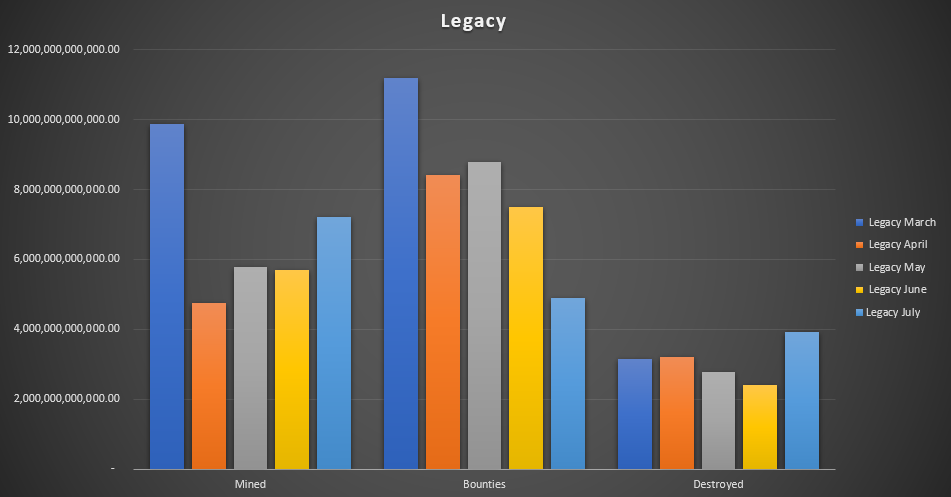
Looking at the wider Legacy Region (Paragon Soul, Esoteria, Impass, Feythabolis, Catch, Omist, Immensea), mining is up 1.6T, bounties are down 2.5T and destruction is up 1.5T
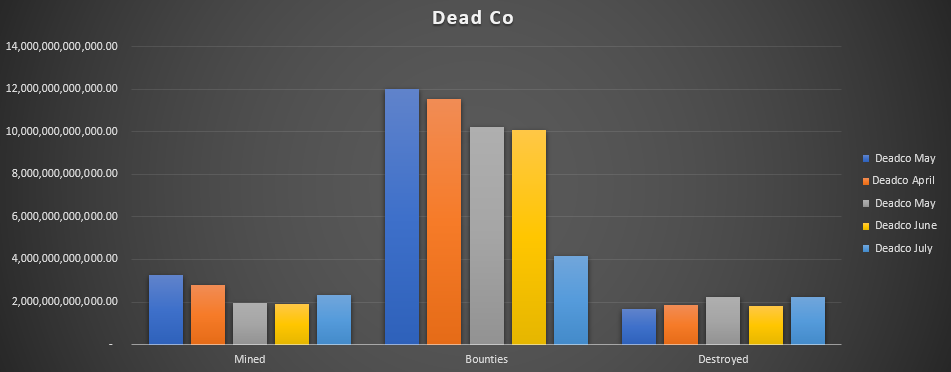
Taking the Dead Co regions as a whole (Fade, Deklein, Branch, Tenal), they have been hit fairly hard by a drop in bounties, dropping 6T from June to July. Their mining is little changed, and destruction is within the usual ranges.
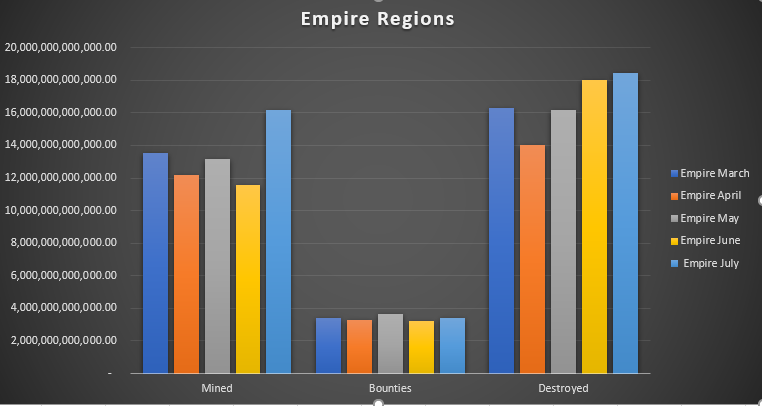
Finally, regions exist outside of Null, of course. The Empire regions, comprising low to highsec, saw an increase in mined value from just under 12T to 16T, while their bounties and destruction stayed roughly similar.
Money, Money, Money
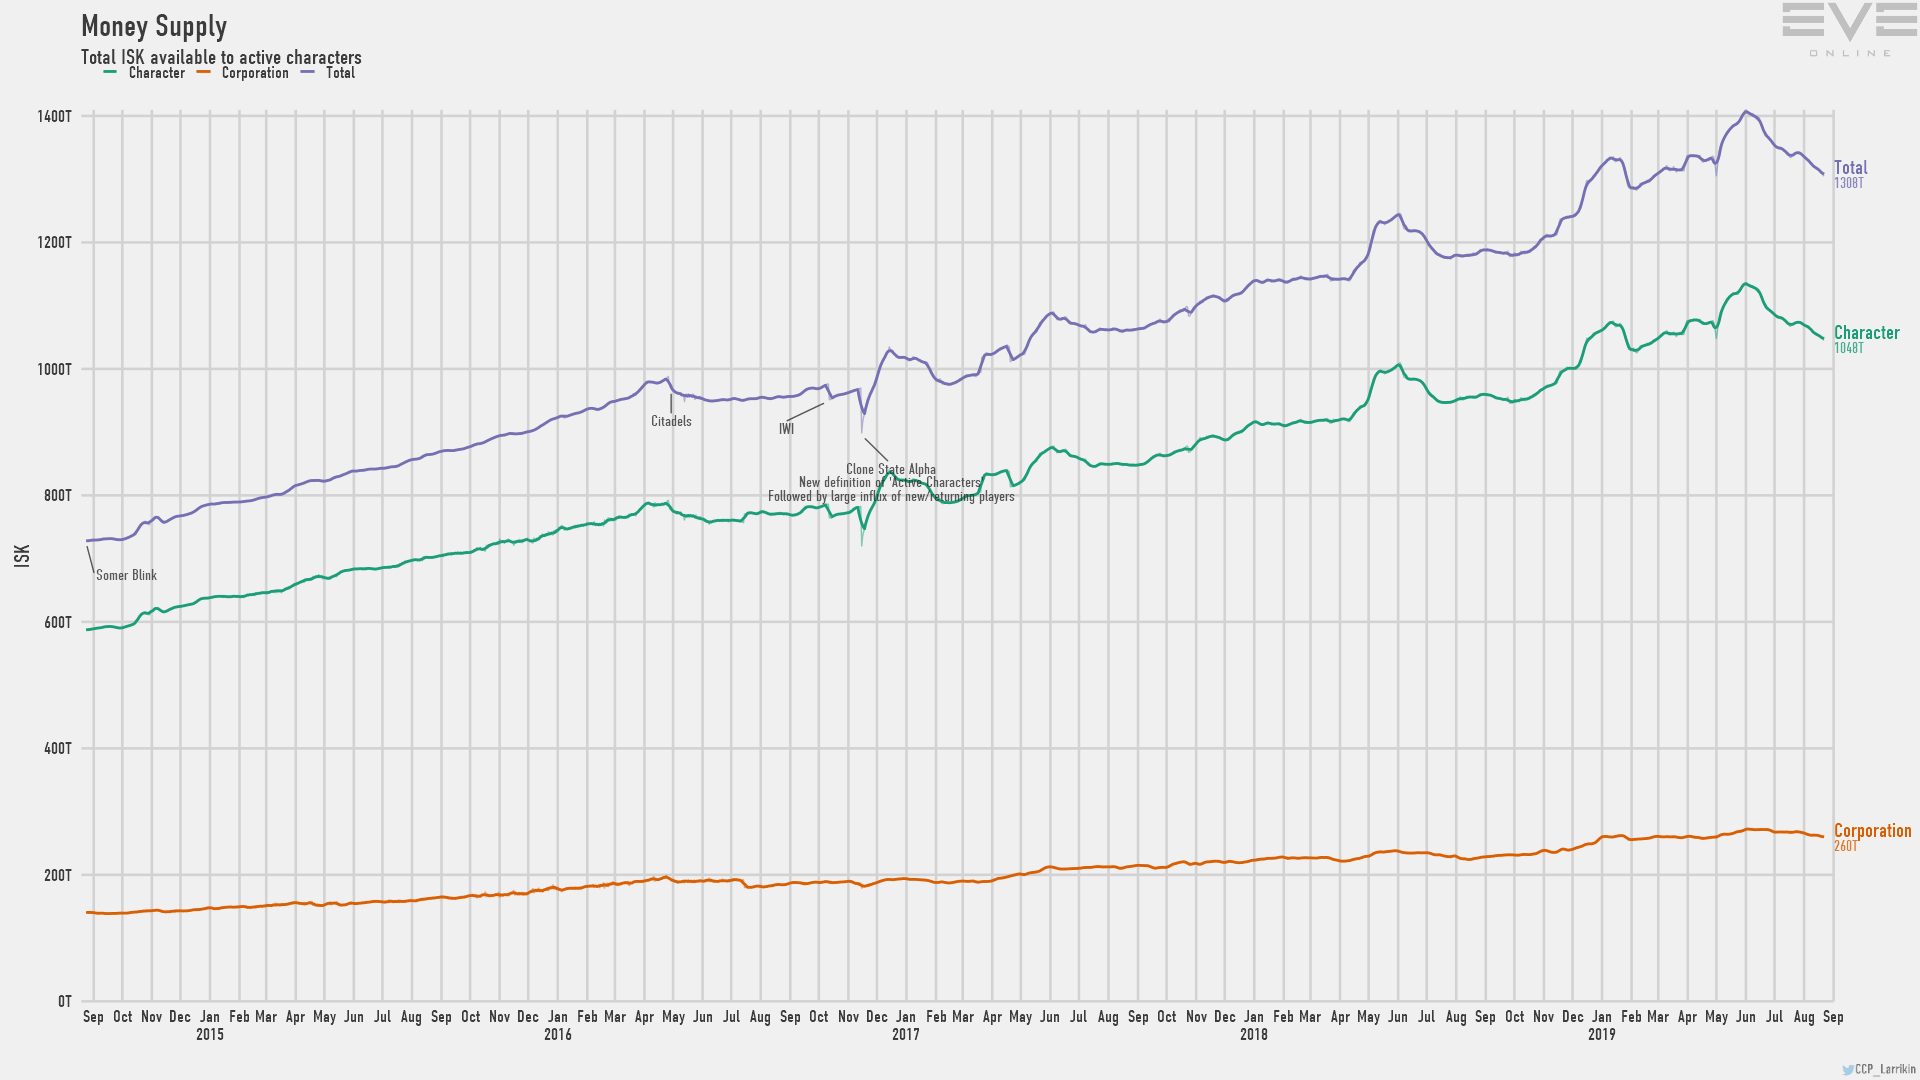
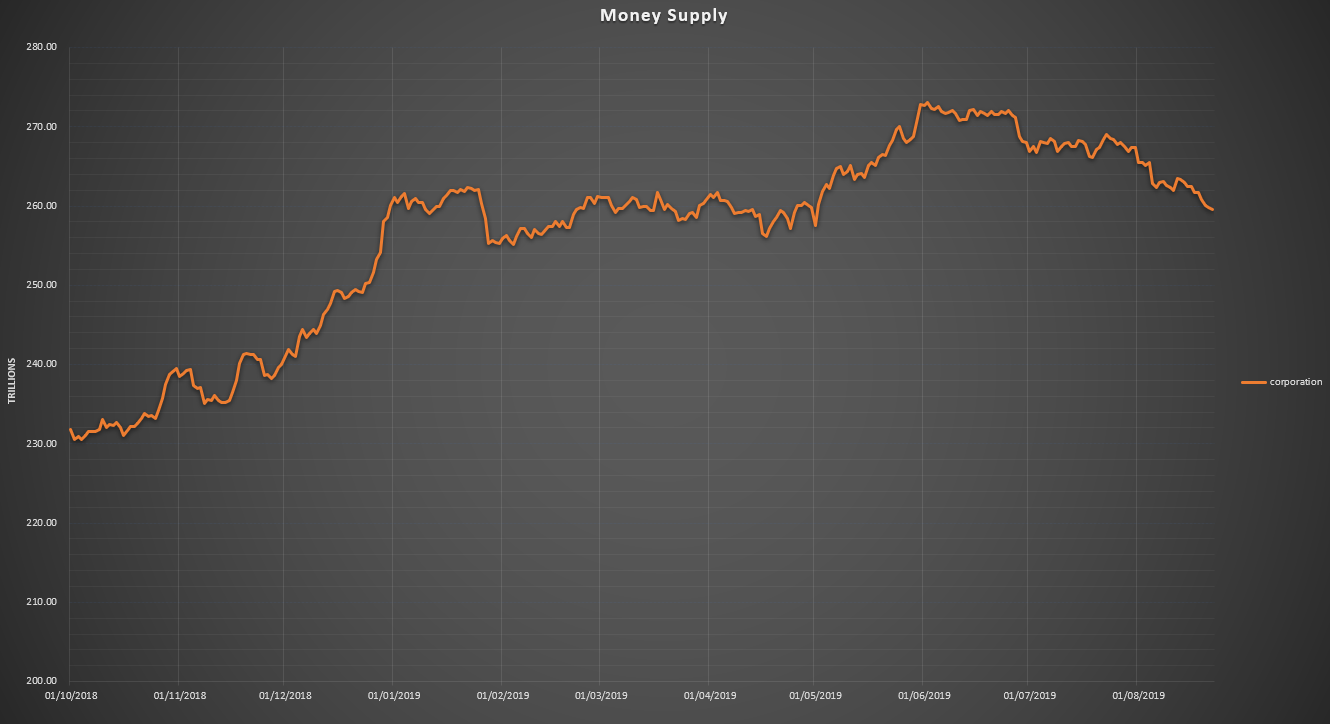
The final thing I want to go over is the money supply. As it has been mentioned that there is too much ISK in Eve. This would be a bad thing, especially if concentrated among a small group of people. As we have discussed earlier, there are some ways that ISK enters the economy (faucets). There is another set of information that shows on the money supply, and that is the total ISK in active character wallets (and corporation wallets but that is a whole load lower and we can look at that in a bit).
The reason that the money supply shows more than just any surplus between faucets and sinks is that the data also includes the ISK in the wallets of any characters who become active, or go inactive as well as GM actions (removing ISK, refunding ISK). Back in ye olde days before Alpha clones, active characters was very simple to calculate. It was the players who had a subscription. While this may have included people who just kept subbing without logging in, it was an easy metric.
Alpha clones somewhat complicated this however, as now there was a need for defining what an active character was. It was decided that an active character was someone who had logged into the game in the last X days. There is a discussion about how long this period is, some think 3 months, some think 1 month, but either way, that was the new definition of an active player.
You can see this on the money supply if you mark the login events, like I have done on this chart of the money supply from October last year to August this year.
The money supply graph is shown since 2012, which has the tendency to flatten daily trends out, which is why I have presented it here on a shorter time-frame.
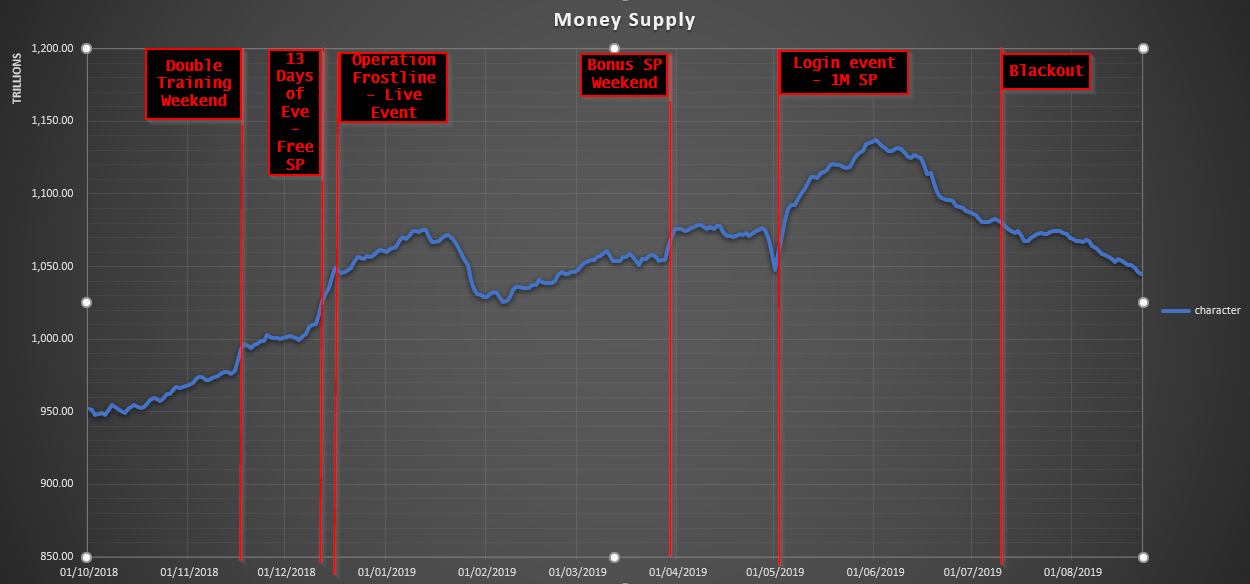
This shows that the amount of ISK in player wallets primarily increases in response to login events. This is because then everyone logs round their Alphas to get the SP or items on offer. The May event shows a prolonged rise in ISK, partially due to some players joining the login event later (there was 3 days you could miss and still get the 1M SP). The following month, you can see the majority of that ISK disappear again as accounts went inactive again. Generally I think CCP use a one-month activity marker as the increase is accompanied by a decrease the following month. If there was a three-month activity marker, the increase would still be there over the next three months.
The corporation wallet value is usually shown on the same chart as the character wallets, which flattens it, as the ISK on character wallets is so much higher than corporation wallets. By separating them out, you can see the trends more clearly.
There are similar rises in corp wallet ISK to the ones seen on the character wallets, with a spike up in December and May. As with the character wallets, there is a downward trend in the past few months, accelerating as the blackout hits. 13T has exited corporation wallets since the Drifters arrived, and this is indicative of a reduction in income from bounties whilst they still have their regular outgoings. A drop in ISK in player wallets indicates an increase in sinks and/or a reduction in active players, unless there are massive GM interventions that month.
Ok, I wasn’t quite finished
I had just wrapped up this piece and was finishing off some tweaks when I decided to see how much blue loot there is each month by source. This proved to be more complicated than I thought because for several months this year, the faucets breakdown looked like this:
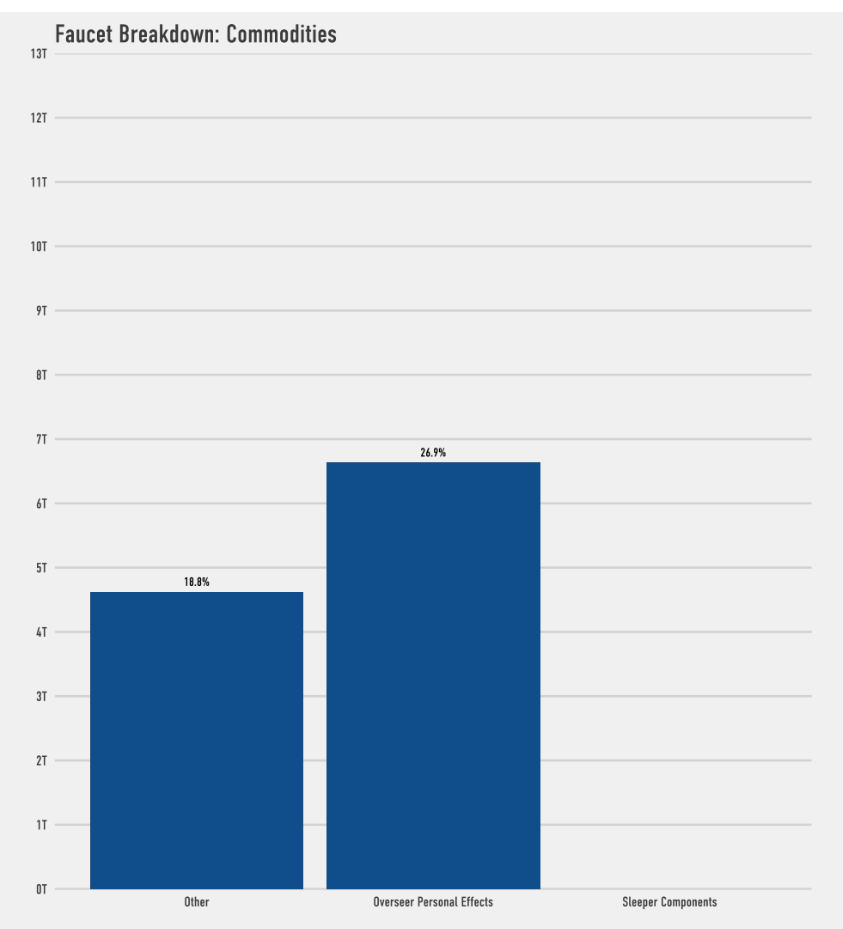
No worries, I will go and grab the “Top Sinks and Faucets over time” CSV that CCP provides. Commodities are not listed in the Top Sinks and Faucets, and as you can see in the link in the previous sentence, they are not shown in the data there either. Given that Commodities are the second largest faucet in the game, they should be counted into this chart.
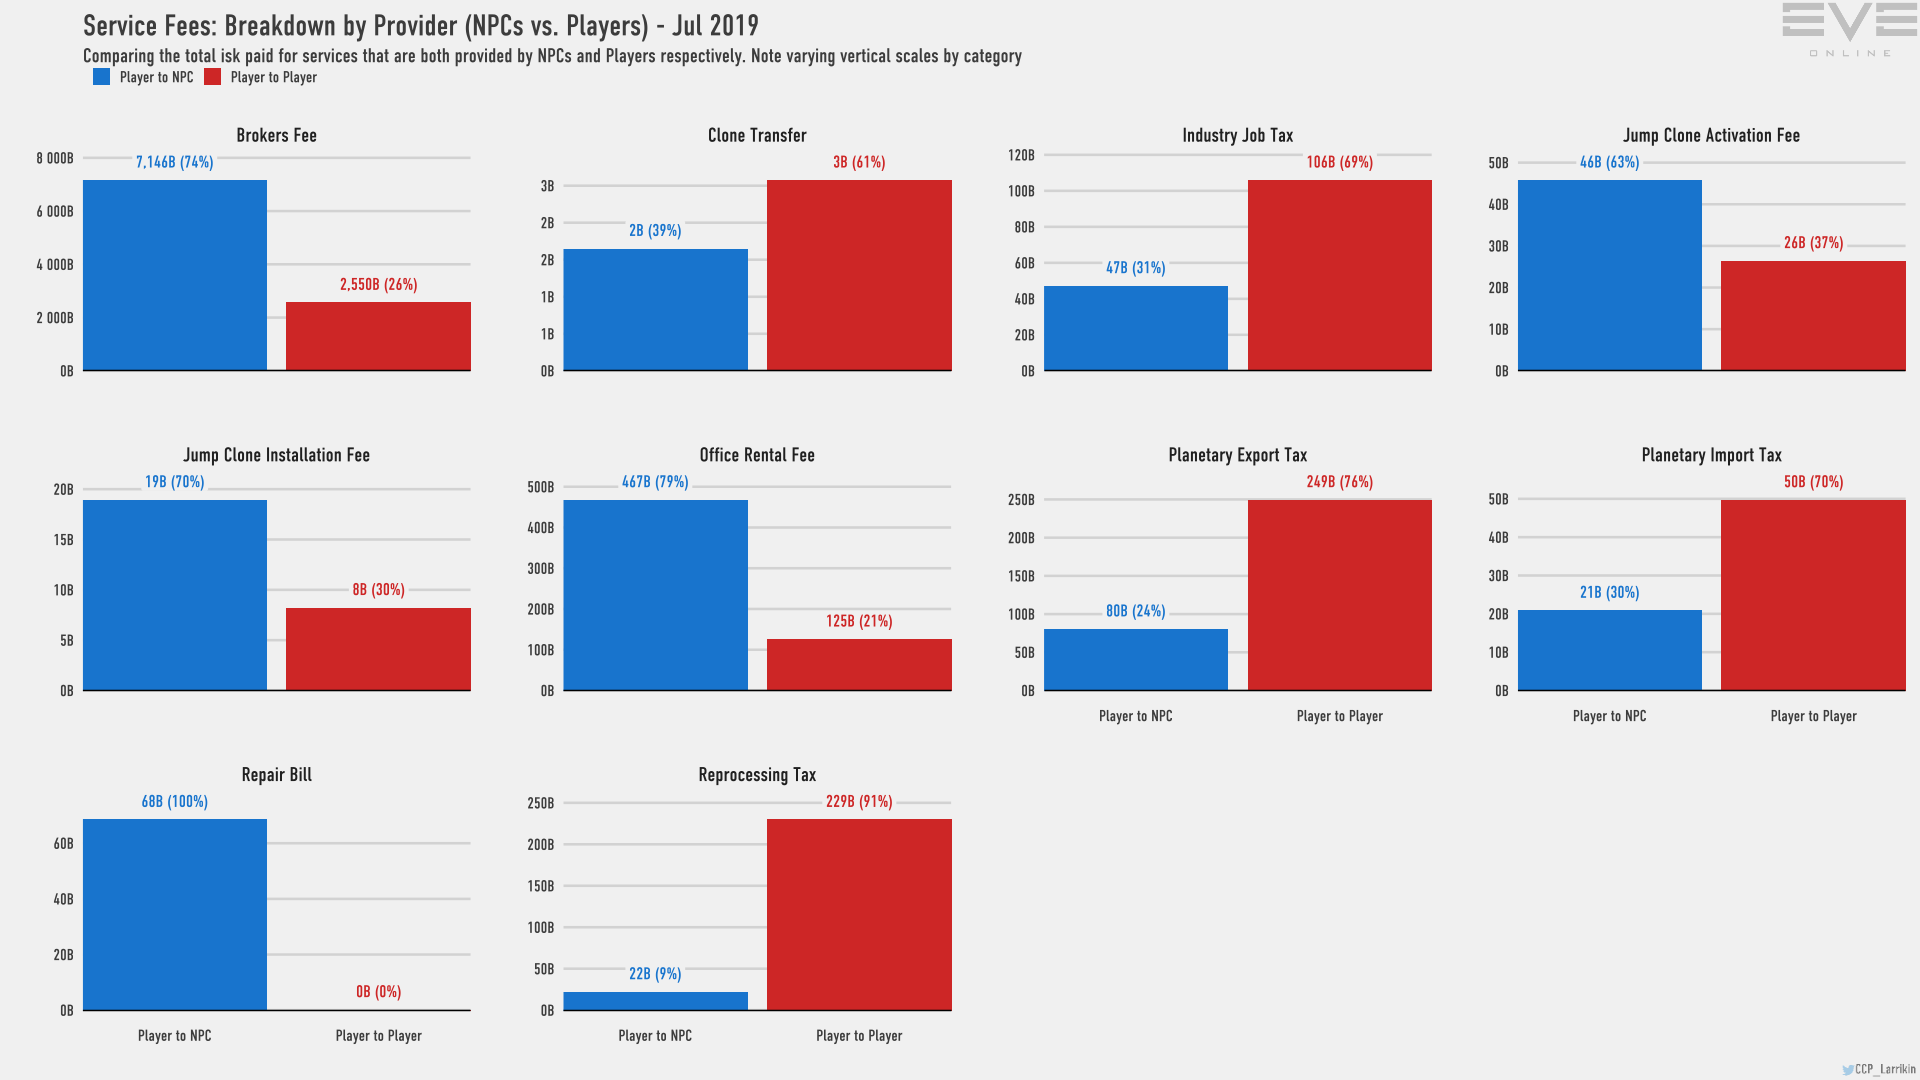
It is already known that the entire region of Cache was missing from several months of the MER this year (this has now been fixed!). I then did one of those things you really regret after starting it. I thought to myself “I wonder if CCP split player and NPC things such as the Industry Job Tax and Broker Fees”, I was also wondering exactly what “Manufacturing” is in the sinks.
The answer to “Do CCP split player and NPC payments in sinks?” is “Sometimes”.
Broker Fees for example, one of the largest sinks in the game, is 10.274T on the MER sinks and faucets this month. However, in the breakdown by provider, 7.146T of Broker Fees goes to NPCs, with 2.55T going to players. This doesn’t add up to 10.274T anyway: it adds up to 9.69T, but even if it did it is not all a sink. This is probably because the MER was set up before Citadels—for a year the MER did not count Citadel markets in trade volume.
Jump Clone Activation Fee is listed on the services breakdown as 46B NPC, 26B player. On the sinks and faucets, it is listed as a 64B sink. Jump clone installation is similarly 19B NPC and 8B player, but listed as a 34B sink. I have looked in the raw data, and this shows it entirely as a sink for the 64B and 34B amounts respectively. Even allowing for rounding, 46+26 is not 64, and 19+8 is not 34.
Planetary Export Tax is listed as a 120B sink, but in the breakdown it is 80B to NPC and 249B to player.
Office rental fee in the sinks and faucets does have the player amount removed from it, and does reflect the services breakdown amount.
Industry Job Tax seems to have the player amount removed from it, but the amount in the sinks and faucets list is 56B, while the services breakdown shows it as 47B.
Repair Bills are 68B in the service fees breakdown list, but 111B in the sinks and faucets list.
In the grand scheme of things, these discrepancies amount to a small fraction of the total, but now I am going to spend the rest of the day wondering what is causing them. I also still don’t know exactly what the Manufacturing Sink is, but I am going to assume it is the Industry Index Fee.
That was a lot of words! And even more graphs! We will take a quick look at the August MER when it arrives because the tax changes come in during that period, and the changes in the dynamics in the sinks and faucets will be interesting to look at. We will do another deep dive when the September MER arrives, looking back over the previous 3 months. I hope that you enjoyed this journey through the MER with slightly different presentation of the data than we see in the devblog.